Overview of the 4 MA Candles Indicator
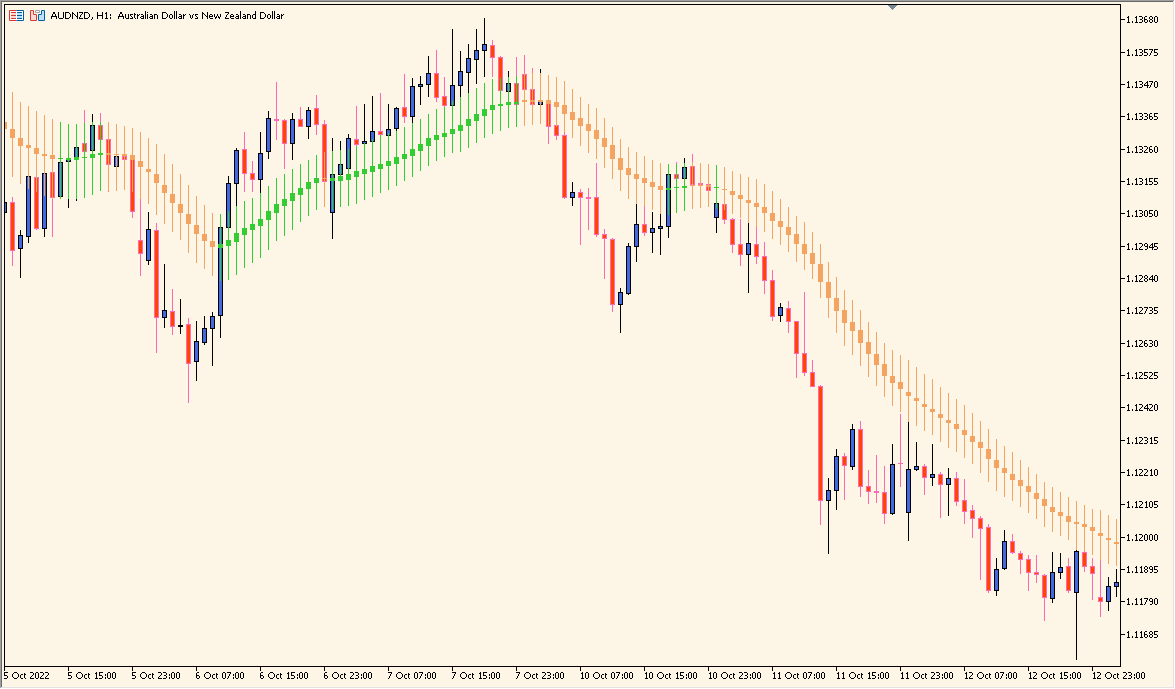
The 4 MA Candles indicator displays candles that are color-coded based on their relation to a moving average. It provides a simple visual way to identify whether the market is trending above or below a chosen moving average line. This helps traders quickly confirm the trend direction without the need for additional lines or clutter on the chart.
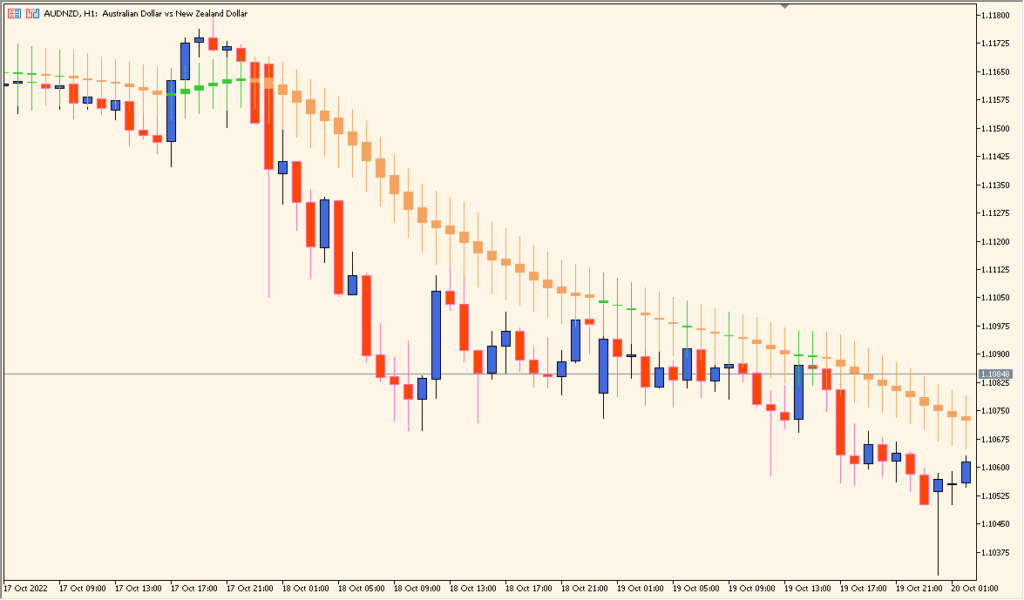
Instead of plotting a traditional moving average line, the indicator colors the candles themselves, allowing a cleaner and more intuitive view of market momentum. When candles stay consistently above the average, the trend is considered bullish, while candles below indicate bearish momentum.
How to Use It in Practice
In practice, the 4 MA Candles indicator can be used to:
- Confirm the trend visually without relying on multiple indicators.
- Filter trades — only take buy setups when candles are above the moving average color zone and sell setups when below.
- Combine with other indicators such as RSI or MACD for confirmation.
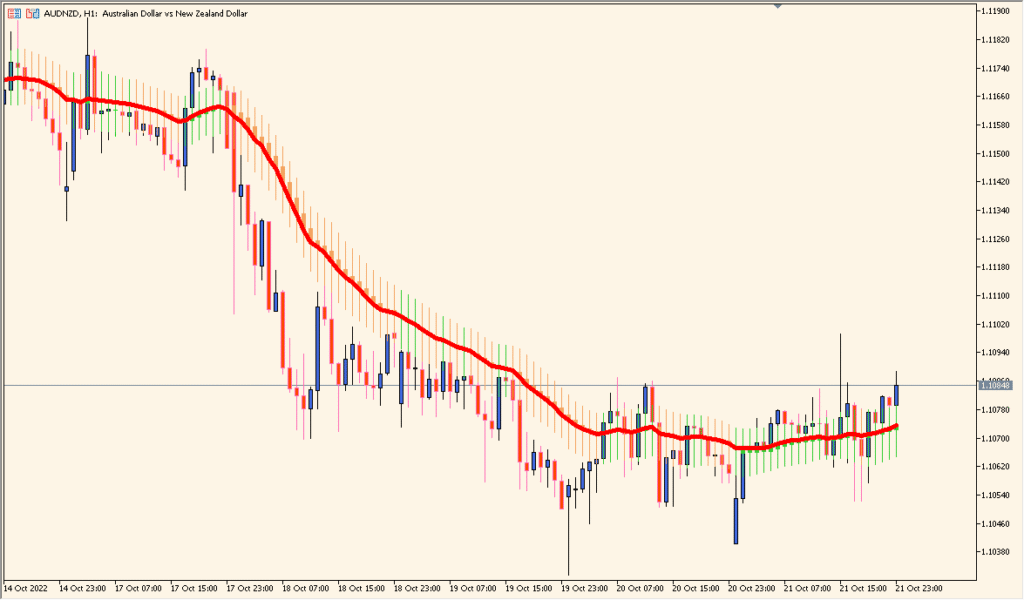
- Identify potential reversal zones when candle color transitions occur.
This tool is especially helpful for traders who prefer clean charts and quick visual confirmation of market direction.
Parameter Explanations
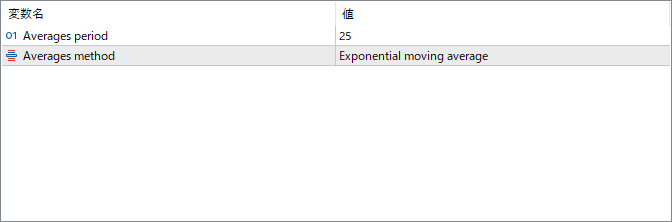
Averages period
Specifies the number of candles used for calculating the moving average. Adjusting this value changes how sensitive the indicator is to price movements. Shorter periods react faster, while longer periods smooth out fluctuations.
Averages method
Defines the type of moving average to apply (e.g., Simple, Exponential, Smoothed, Linear Weighted). The method affects how recent prices influence the average and, consequently, how candles are colored.