Overview of the WPR Histogram Vol Indicator
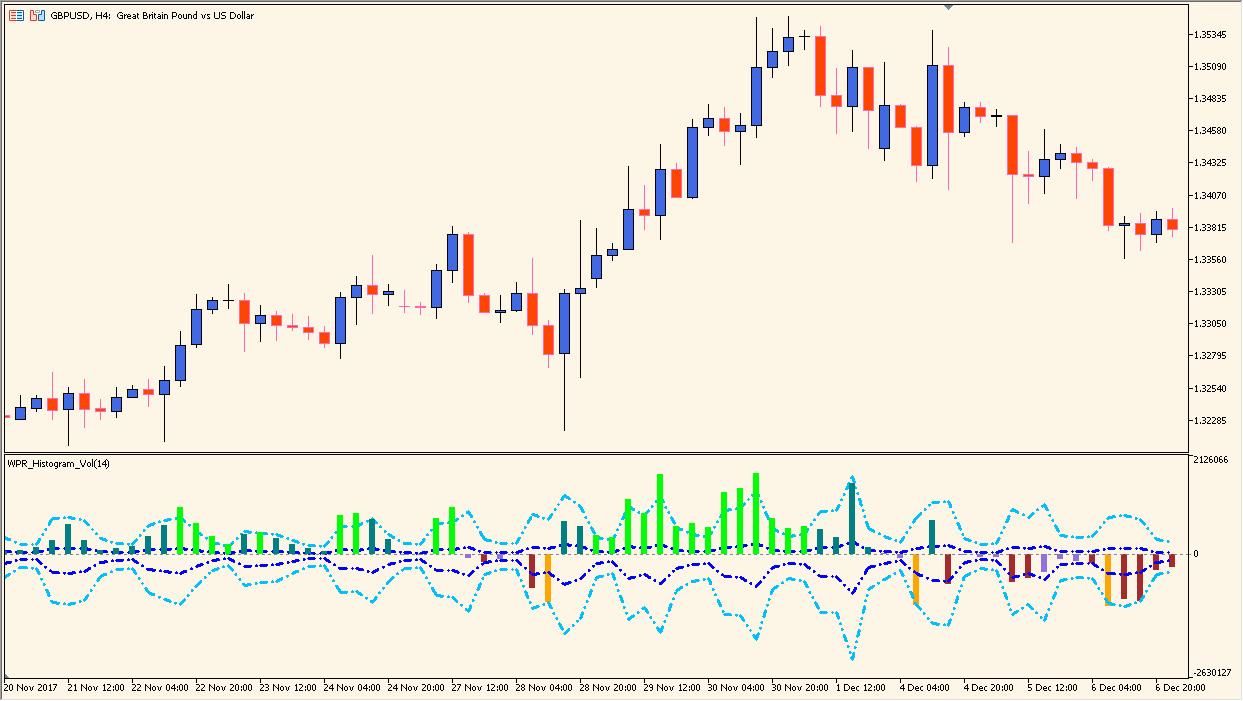
The WPR Histogram Vol indicator for MT4 combines the Williams Percent Range (WPR) with volume data to create a dynamic histogram that reflects both market momentum and participation. The histogram bars change color based on WPR direction and intensity, while also being influenced by tick volume, allowing traders to see when strong momentum coincides with higher trading activity.
This approach makes it easier to spot overbought and oversold conditions, volume-supported reversals, or fading momentum periods. It’s a useful tool for traders who want to visually assess both price strength and market engagement at the same time.
How to Use It in Practice
In live trading, you can use the WPR Histogram Vol indicator to:
- Identify potential overbought or oversold zones based on histogram extremes.
- Confirm price momentum when strong volume aligns with rising histogram bars.
- Detect early signs of a possible reversal when the histogram begins to contract.
- Use as a confirmation filter with other trend-following or oscillator tools.
Because it factors in tick volume, this indicator is especially helpful in markets where volume behavior offers additional confirmation of market sentiment shifts.
Parameter Explanations
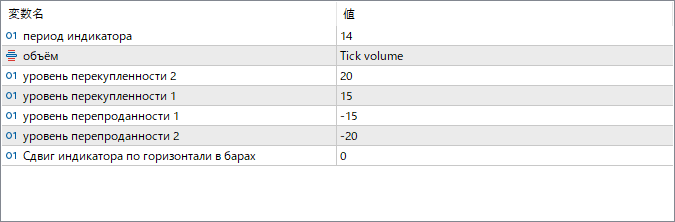
период индикатора
Sets the calculation period for the Williams Percent Range. A shorter period increases sensitivity, while a longer one smooths out fluctuations.
объём
Selects the volume type used in the calculation. “Tick volume” measures activity based on price changes per bar.
уровень перекупленности 1 / 2
Defines the first and second overbought thresholds. These levels mark areas where price may be stretched to the upside.
уровень перепроданности 1 / 2
Defines the first and second oversold thresholds. These help identify potential reversal points on the downside.
Сдвиг индикатора по горизонтали в барах
Moves the histogram horizontally by a set number of bars for display adjustment without affecting calculation.