Overview of the Bollinger Bands (Squeeze) Indicator
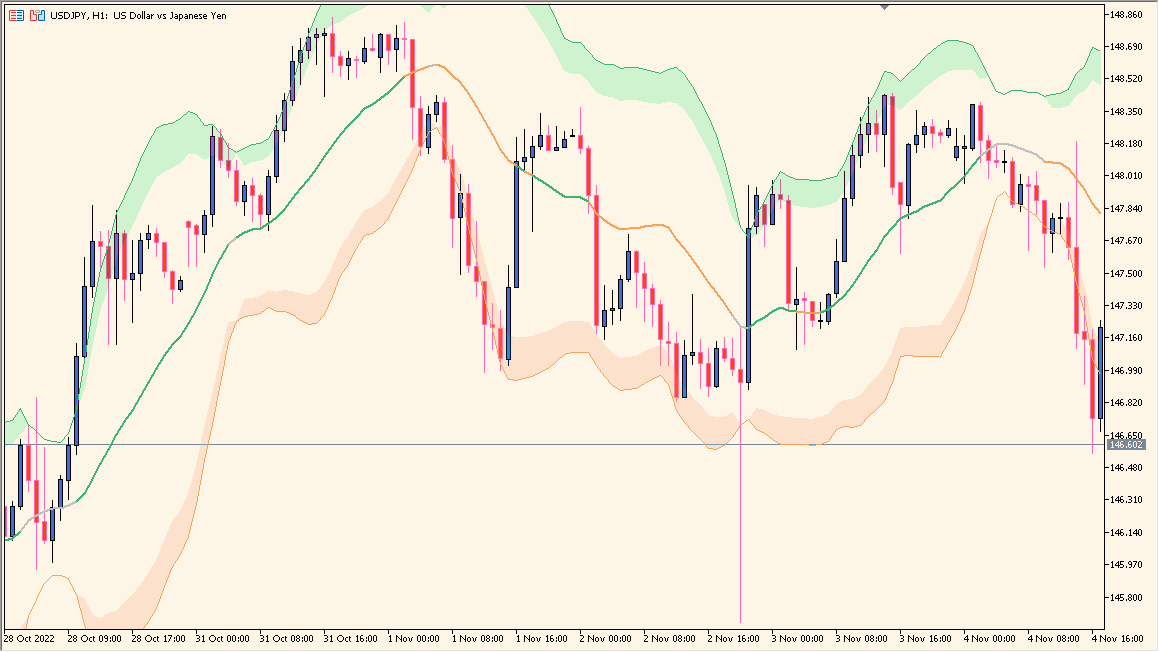
The Bollinger Bands (Squeeze) indicator for MT4 helps traders identify periods of low volatility that often precede strong price movements. It combines standard Bollinger Bands with an ATR-based expansion filter to highlight areas where the market is “squeezing” before a potential breakout. This makes it a useful tool for spotting upcoming volatility shifts.
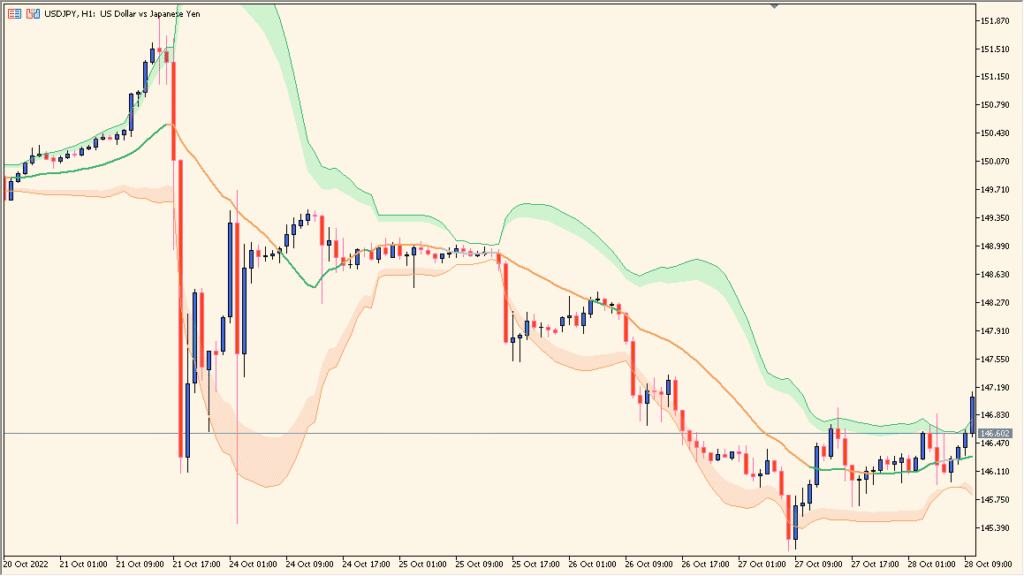
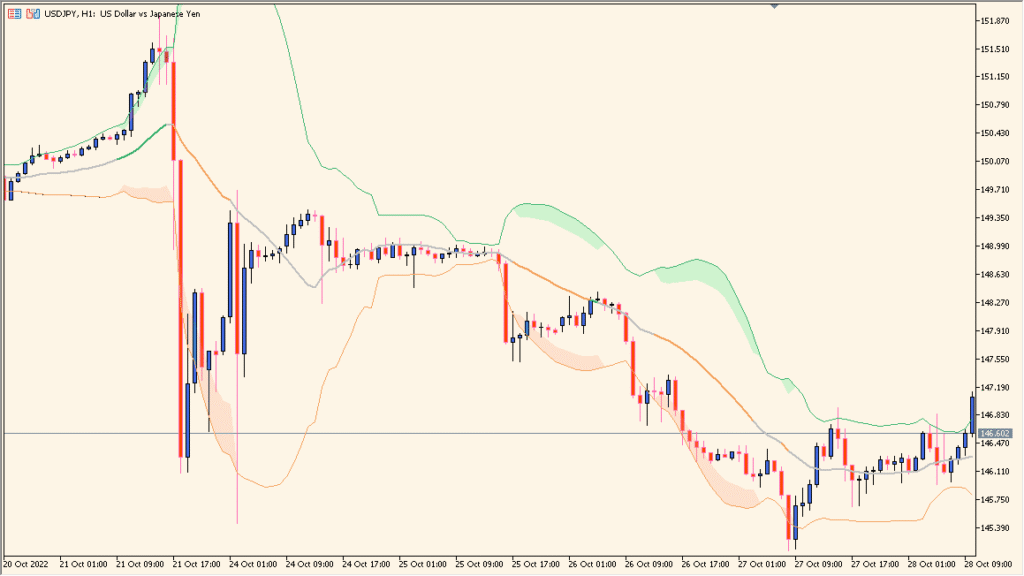
The indicator visually marks contraction zones when the distance between Bollinger Bands narrows below a certain percentage level, signaling that the market is consolidating and may soon experience a breakout.
How to Use It in Practice
In live trading, this indicator can be used to:
- Identify volatility contraction zones where a breakout might occur soon.
- Combine with momentum or volume indicators to confirm breakout direction.
- Set alerts when the squeeze condition is met, helping anticipate trend changes early.
- Use visually shaded zones to filter ranging or quiet market conditions.
This makes it helpful for breakout traders or those seeking to enter positions during the early phase of expanding volatility.
Parameter Explanations
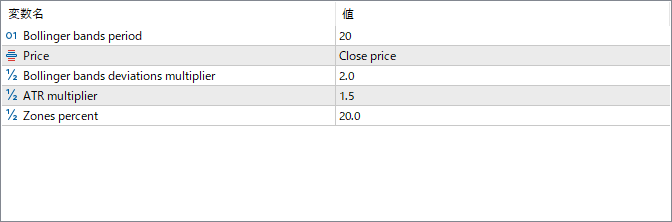
Bollinger bands period
Defines the number of bars used to calculate the Bollinger Bands. A shorter period reacts faster to price changes, while a longer period smooths out the bands.
Price
Specifies which price (Close, Open, High, Low, etc.) is used in the Bollinger Bands calculation.
Bollinger bands deviations multiplier
Sets how far the upper and lower Bollinger Bands are from the moving average in terms of standard deviations. Higher values create wider bands and fewer squeeze signals.
ATR multiplier
Adjusts the sensitivity of the squeeze zones using the Average True Range. Increasing this value widens the threshold for volatility comparison.
Zones percent
Determines the percentage threshold at which the squeeze condition is triggered. Lower values create more frequent signals, while higher values focus on stronger contraction phases.