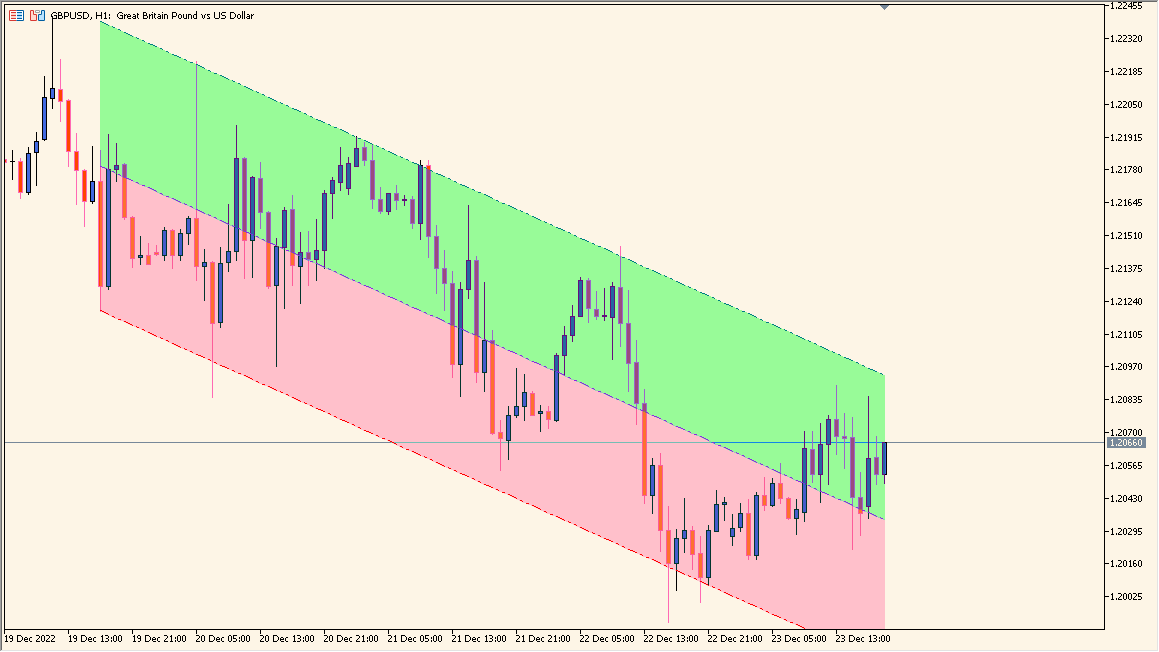
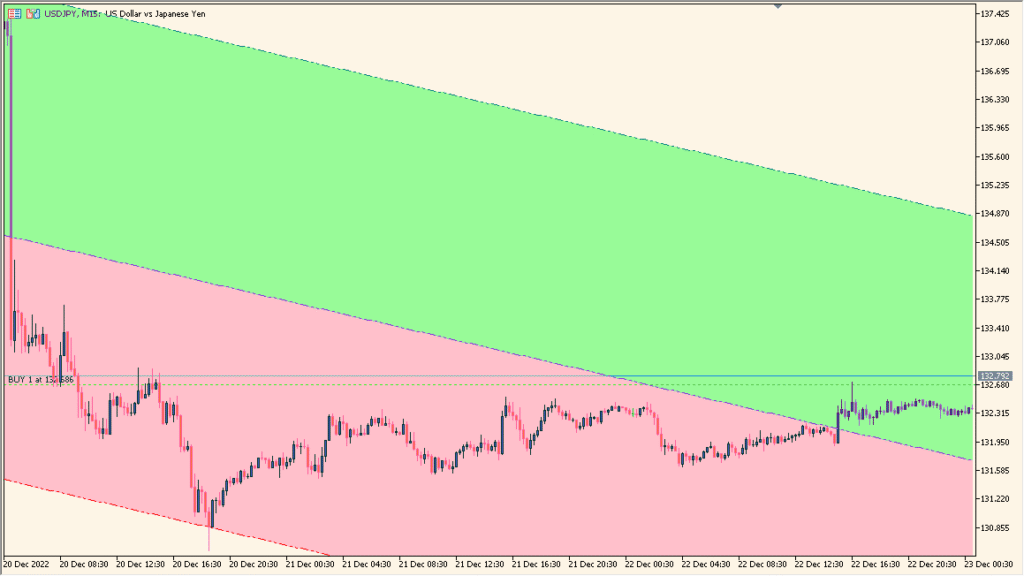
Overview of the Linear Regression Channel Cloud Indicator
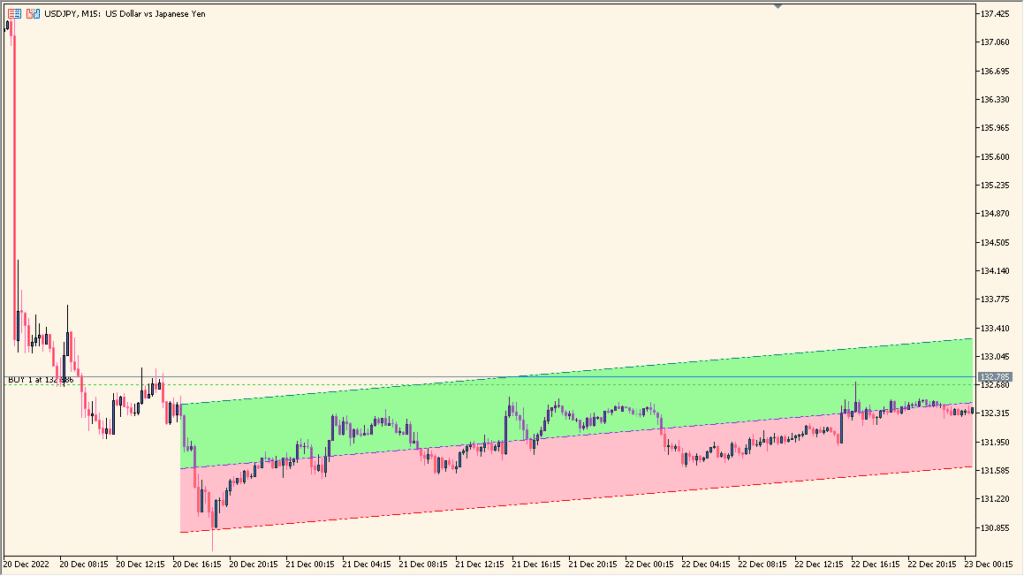
The Linear Regression Channel Cloud indicator for MT4 draws a linear regression line surrounded by two parallel bands that represent the standard deviation of price over a selected period. The area between the upper and lower bands is filled with color, forming a “cloud” that helps visualize the prevailing trend and potential overbought or oversold zones. When the price stays within the channel, it indicates a stable trend, while a breakout can signal a possible trend reversal or continuation.
This indicator is commonly used by traders to identify dynamic support and resistance levels based on price distribution around the regression line. It adapts automatically to price volatility, making it a practical tool for trend-following and channel-trading strategies.
How to Use It in Practice
In live trading, you can use the Linear Regression Channel Cloud indicator to:
- Identify the current market trend — the slope of the channel shows the direction.
- Spot overbought or oversold conditions when price moves outside the upper or lower channel.
- Plan entries near the channel borders for mean-reversion strategies.
- Use the cloud zones as dynamic support and resistance for setting stops or targets.
This indicator works well on all timeframes and instruments, especially when combined with momentum tools for confirmation of breakout strength.
Parameter Explanations
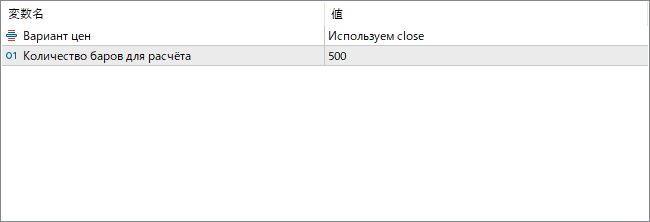
Вариант цен
Specifies which price type is used for calculation, such as close, open, high, or low. The choice determines the data points from which the regression line is built.
Количество баров для расчёта
Defines how many bars are used in the linear regression calculation. A higher value smooths the channel and reflects longer-term trends, while a smaller number makes it more responsive to short-term movements.