Overview of the isymbol Indicator
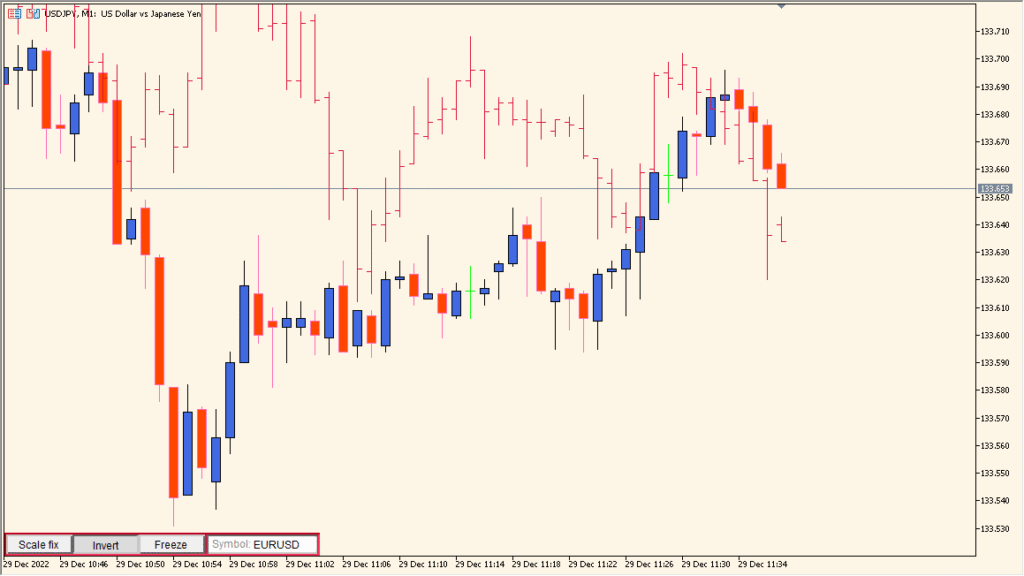
The isymbol indicator for MT4 allows traders to display the price movement of another symbol directly on the current chart. This makes it easy to visually compare correlations or divergences between two different instruments without switching between charts.
It simply overlays the selected symbol’s price line on top of the active chart, making it a useful tool for correlation analysis, pair trading, or monitoring related assets side by side.
How to Use It in Practice
In practical use, the isymbol indicator helps traders to:
- Compare the price movement of two correlated pairs, such as EURUSD and GBPUSD.
- Identify divergence opportunities between related symbols.
- Overlay stock indices, commodities, or crypto pairs for visual comparison.
- Analyze market relationships without needing multiple open charts.
This is particularly useful for traders who rely on correlation strategies or want to keep related assets visible at a glance.
Parameter Explanations
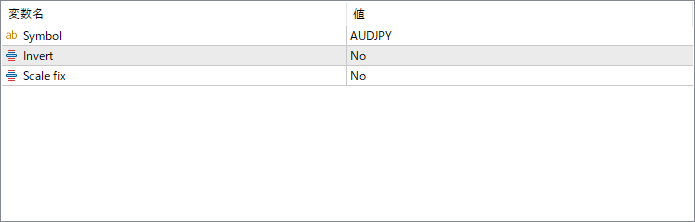
Symbol
Specifies which symbol’s price you want to display on the current chart (e.g., EURUSD, GBPUSD, XAUUSD).
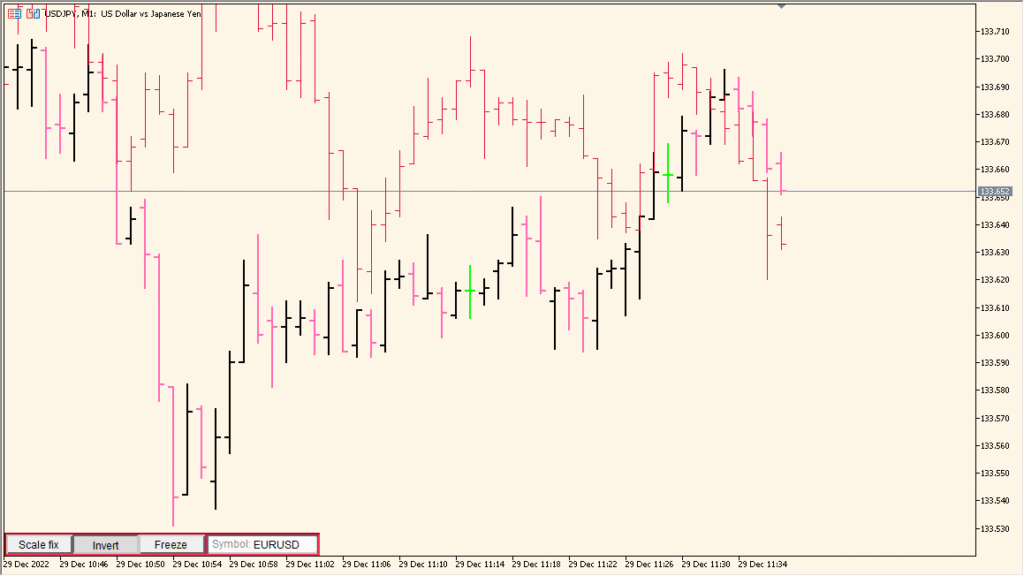
Invert
Flips the displayed price values of the selected symbol, useful for comparing inverse relationships.
Scale fix
Determines whether the overlaid symbol is adjusted to fit the same price scale as the main chart or kept at its native scale.