Overview of the Fibo_retrace Indicator

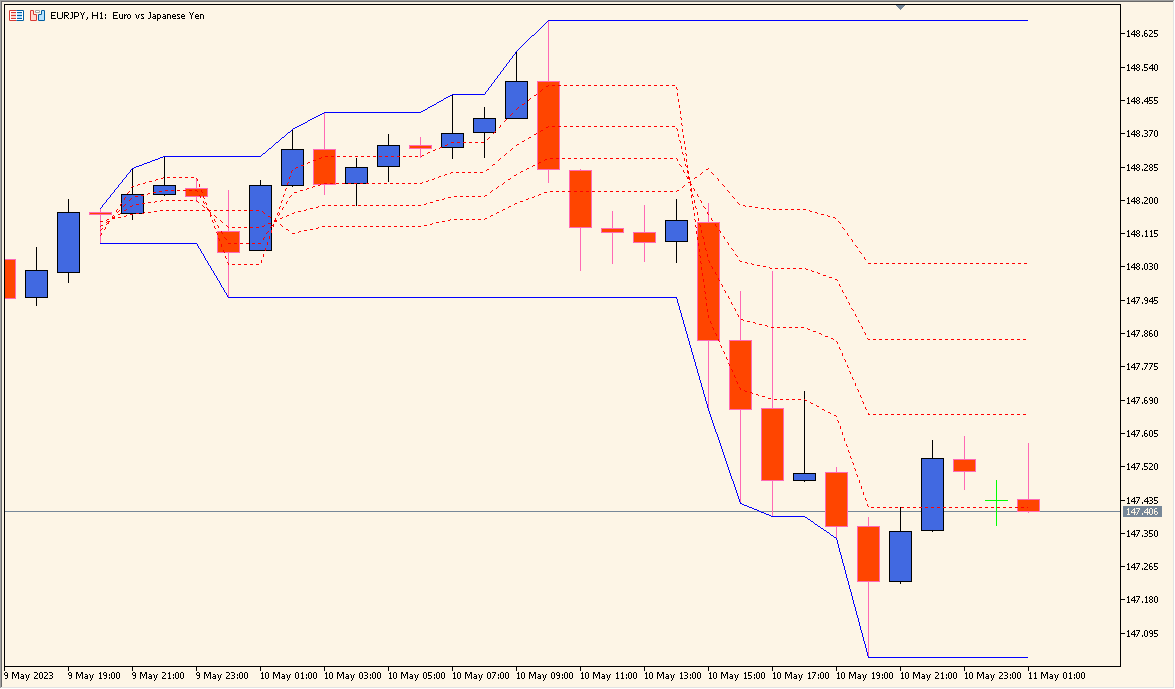
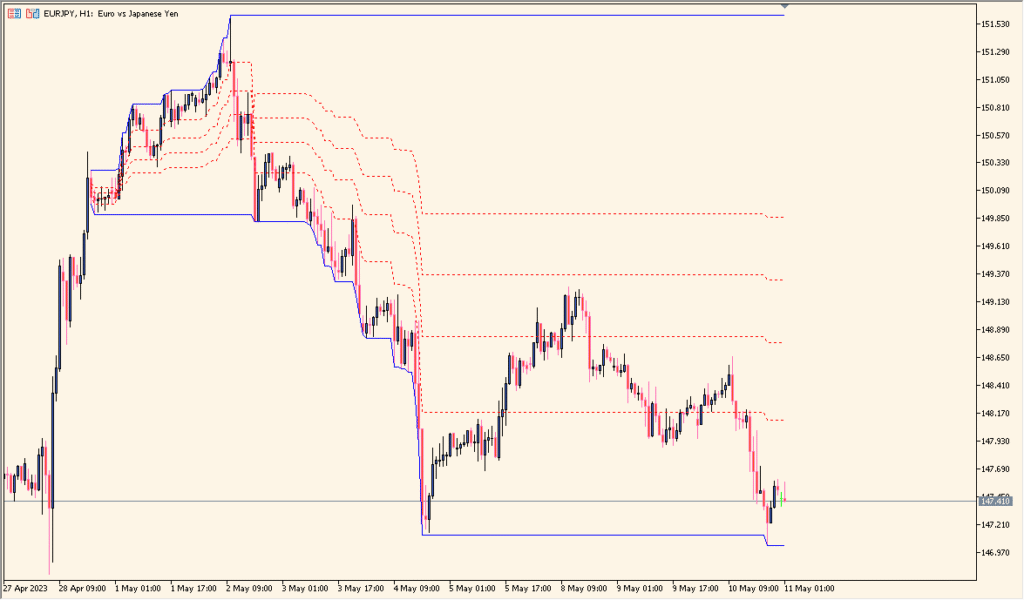
The Fibo_retrace indicator automatically detects recent price swings and draws Fibonacci retracement levels on the chart. It helps traders quickly see where price may react based on common Fibonacci ratios. The indicator updates as new highs and lows form, keeping the levels relevant to the latest market structure.
It is designed for traders who want a clean, automatic way to visualize retracement points without manually drawing Fibonacci tools each time the market shifts.
How to Use It in Practice
In live trading, you can use the Fibo_retrace indicator to:
- Identify potential pullback areas during trends.
- Find confluence zones with support/resistance or trendlines.
- Plan entries by waiting for price to retrace to a key Fibonacci ratio.
- Use the levels as potential stop-loss or take-profit reference points.
The indicator is useful for traders who rely on Fibonacci structure and want updates to happen automatically as the market creates new swing points.
Parameter Explanations
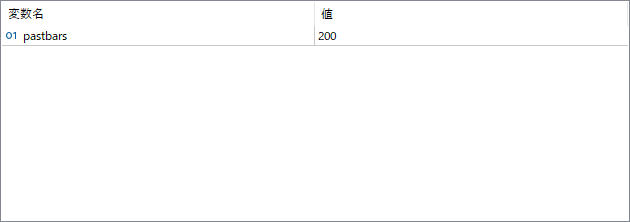
pastbars
Defines how many bars back the indicator looks when determining the latest swing high and swing low. Increasing this value makes it detect larger swings, while lowering it makes it react to smaller and more recent movements.