Overview of the Indicator
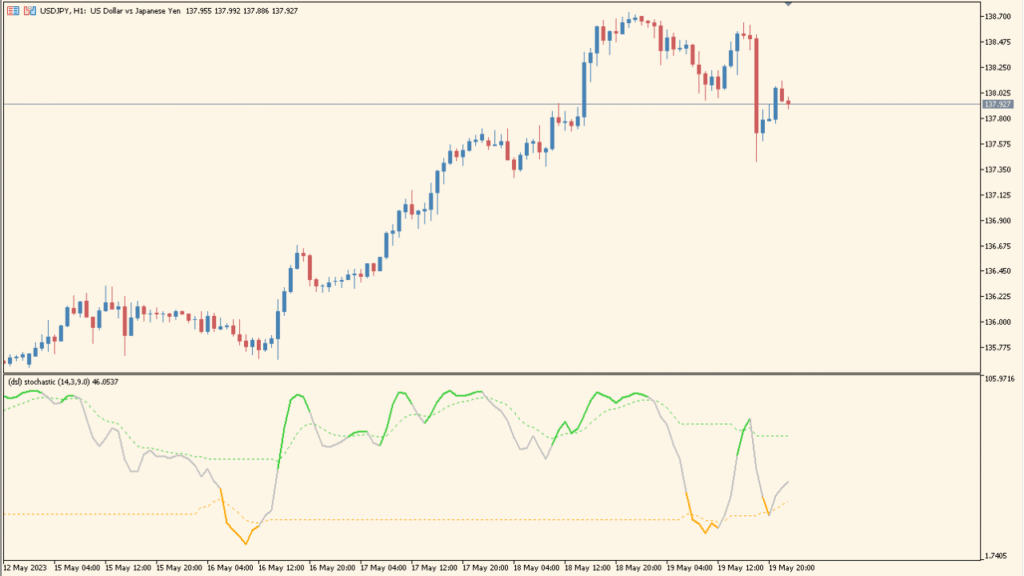
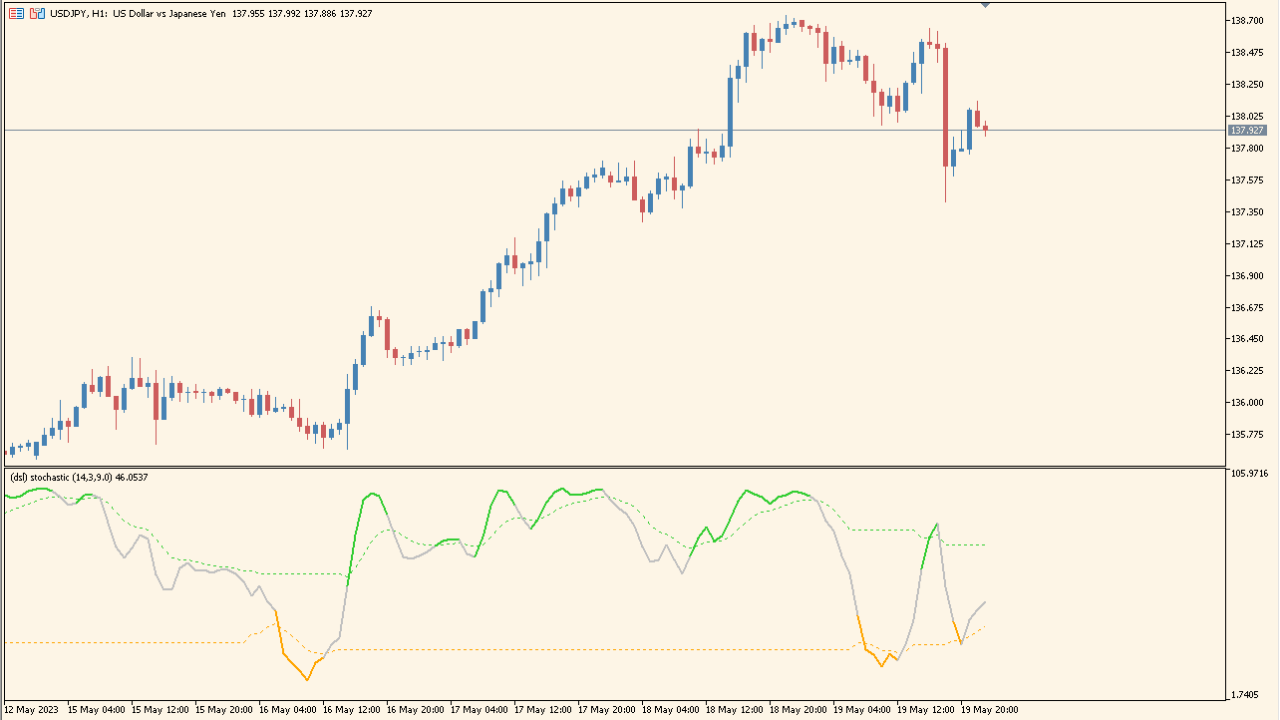
This indicator is a variation of the classic Stochastic oscillator, enhanced with DSL (Discontinued Signal Line) logic. It smooths the stochastic values and uses color transitions to highlight changes in momentum. The goal is to make overbought and oversold conditions easier to read and to give clearer visual cues during trend shifts.
The lines fluctuate within a fixed range, helping traders quickly assess market strength and potential turning points without relying on noisy raw stochastic data.
How to Use It in Practice
In live trading, the DSL Stochastic can be used to:
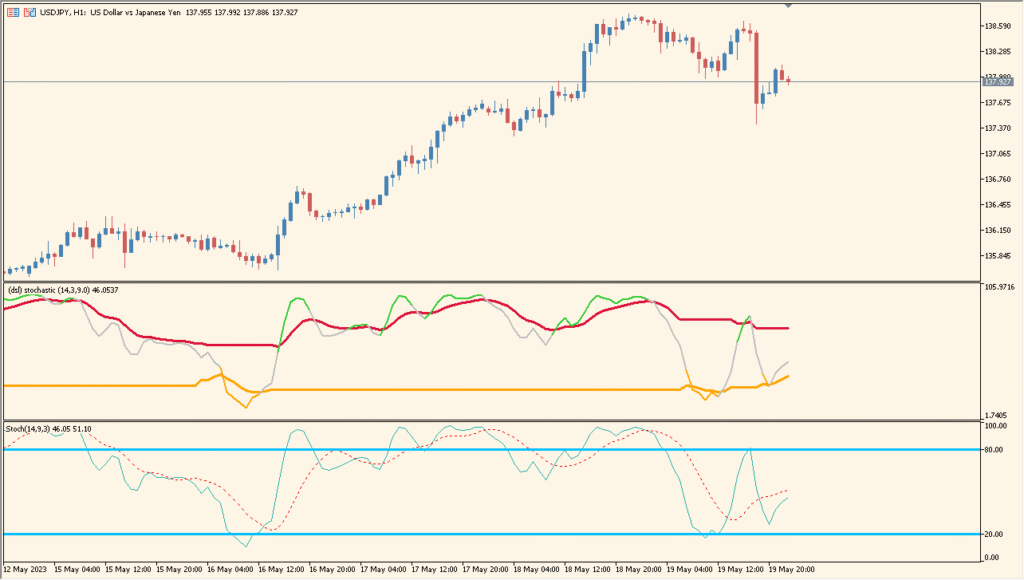
- Identify overbought and oversold zones when the line reaches extreme levels.
- Spot momentum shifts through DSL-based color changes.
- Use crossovers between the stochastic line and the signal line as potential entry or exit triggers.
- Filter trades by observing whether momentum supports the current trend direction.
The smoothing effect helps avoid false signals in choppy markets while still responding well to genuine momentum changes.
Parameter Explanations
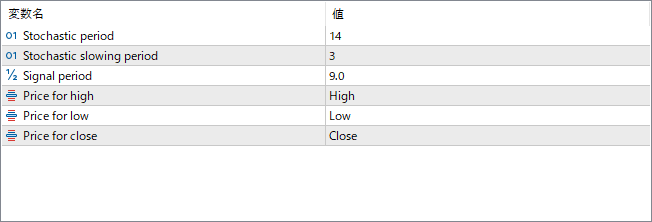
Stochastic period
Determines how many bars are used to calculate the main stochastic value. A shorter period reacts faster to price changes, while a longer one smooths the output.
Stochastic slowing period
Applies additional smoothing to the raw stochastic value to reduce short-term noise.
Signal period
Sets the smoothing for the signal line used for crossovers with the main stochastic line.
Price for high
Selects which price value is used as “High” in the calculation.
Price for low
Selects which price value is used as “Low” in the calculation.
Price for close
Defines which price value is treated as the closing price for the oscillator calculation.