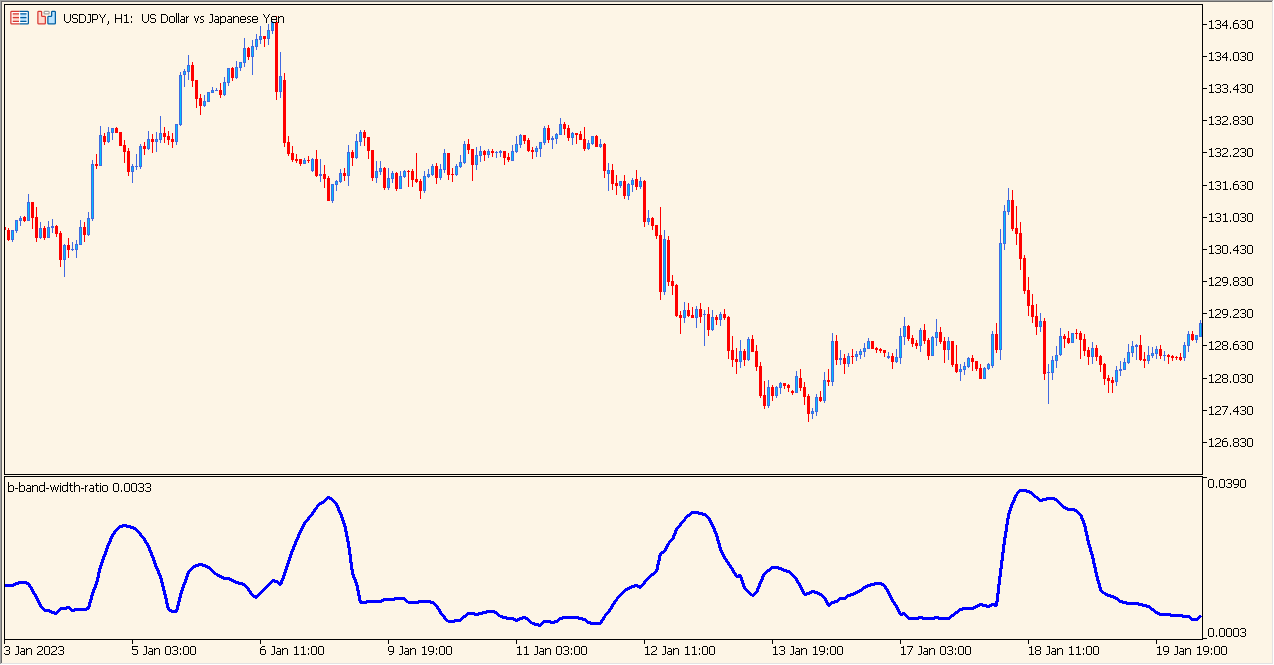
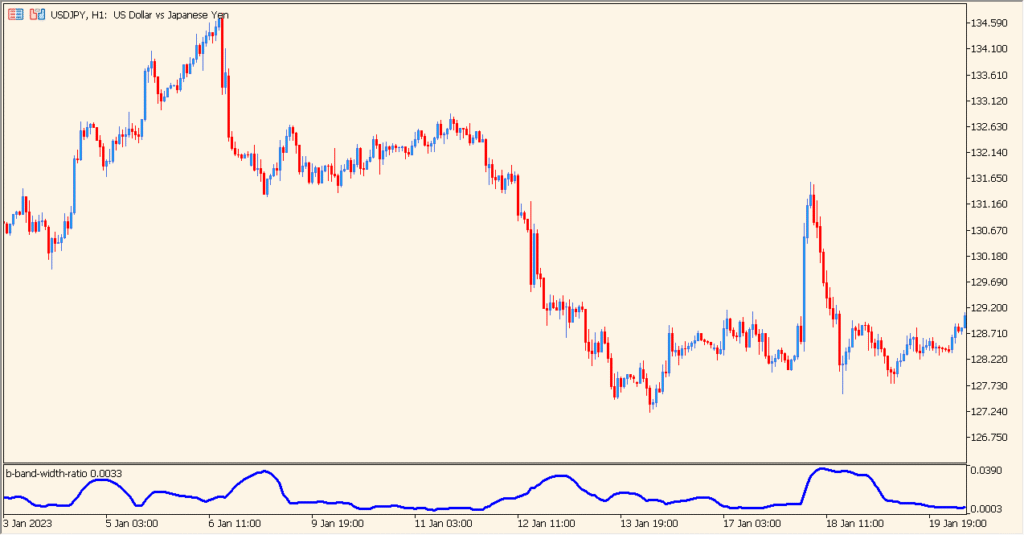
Indicator Overview
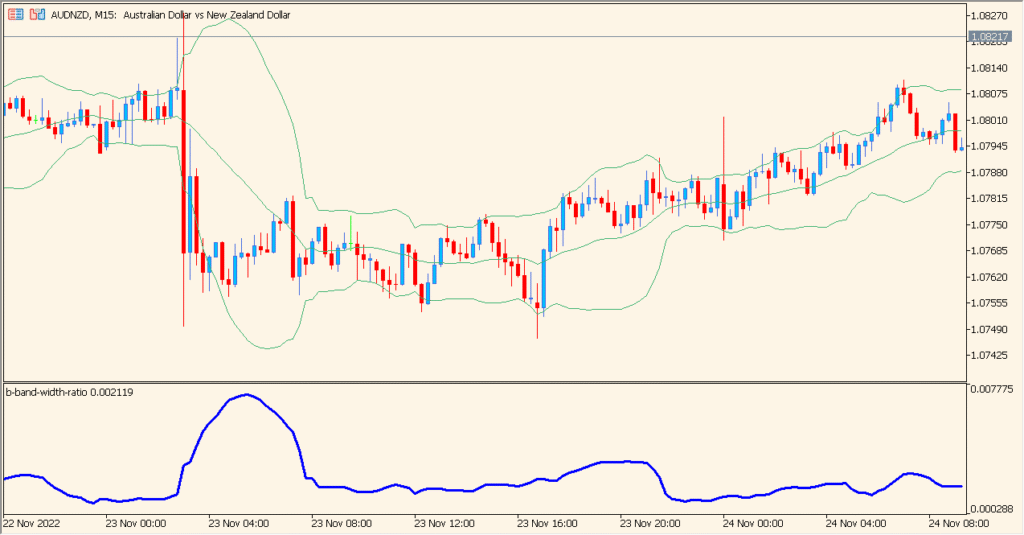
The b-band-width-ratio indicator for MT4 measures the relative width of the Bollinger Bands and displays it as a line below the main chart. When the line is low, volatility is contracting. When the line rises, volatility is expanding. This allows traders to quickly spot market phases where price is quiet and likely preparing to break out.
The calculation is based on the ratio between the current Bollinger Band width and the moving average values, making it useful for identifying volatility cycles in any market.
How to Use It in Practice
In live trading, the b-band-width-ratio indicator can help you:
- Identify low-volatility consolidation zones with potential for breakout setups
- Confirm volatility expansion after a breakout or trend acceleration
- Filter entry timing by avoiding flat, directionless market periods
- Monitor volatility conditions without relying only on price action visually
This indicator works well when combined with support/resistance levels or trend-based strategies that depend on volatility changes.
Parameters
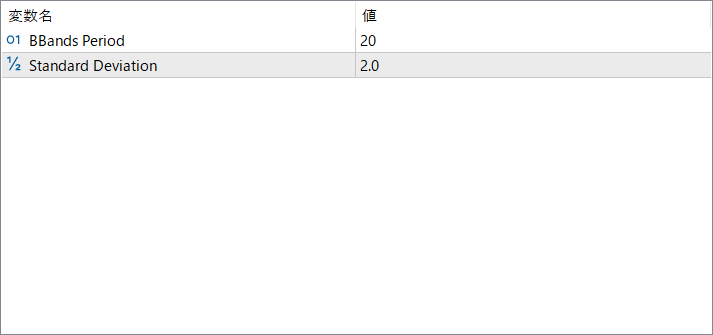
BBands Period
Sets the number of bars used to calculate the Bollinger Bands. Shorter periods make the indicator react faster, while longer periods smooth out volatility cycles.
Standard Deviation
Defines the distance of the upper and lower Bollinger Bands from the moving average. Higher values widen the bands, reducing sensitivity to smaller price movements.