Indicator Overview
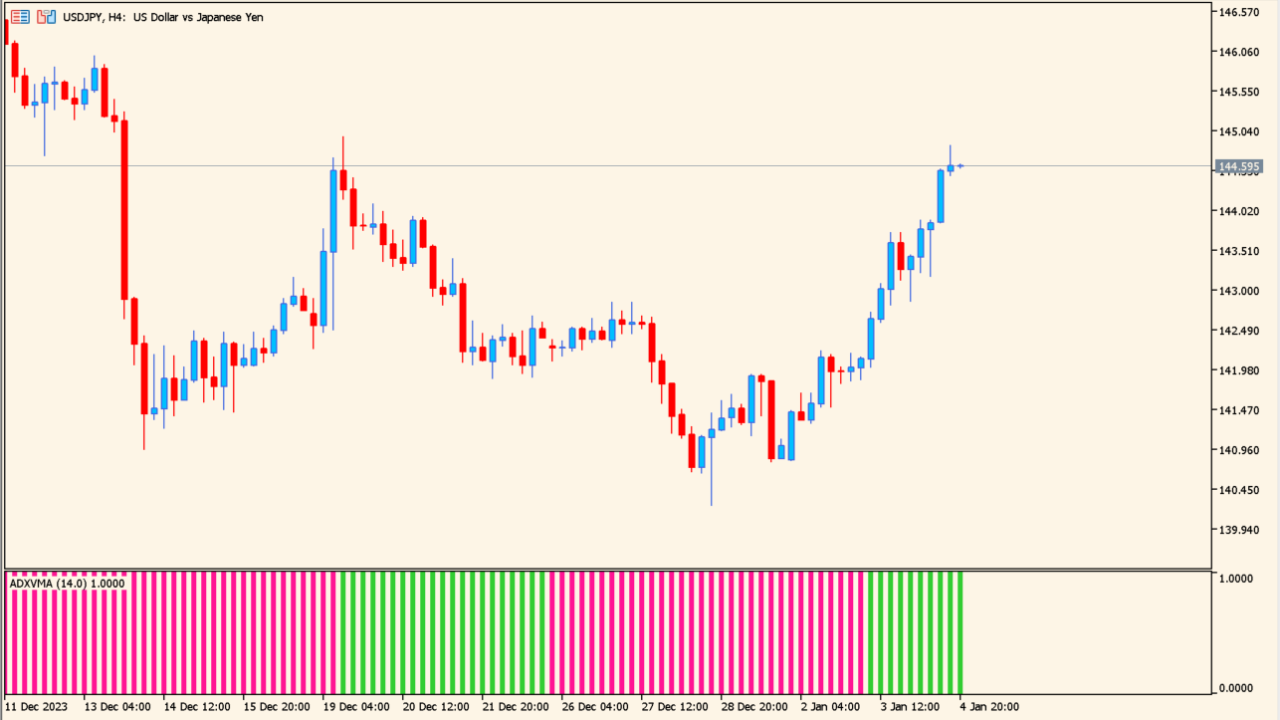
The adx-yma-histogram indicator is a simplified trend strength tool based on the Average Directional Index (ADX). It converts ADX data into a clean histogram, making it easier to judge whether the market is trending or ranging without reading complex lines.
The histogram focuses on strength rather than direction. When the bars are active and consistent, it suggests a market with momentum. Flat or weak behavior points to consolidation or low trend quality.
How to Use It in Practice
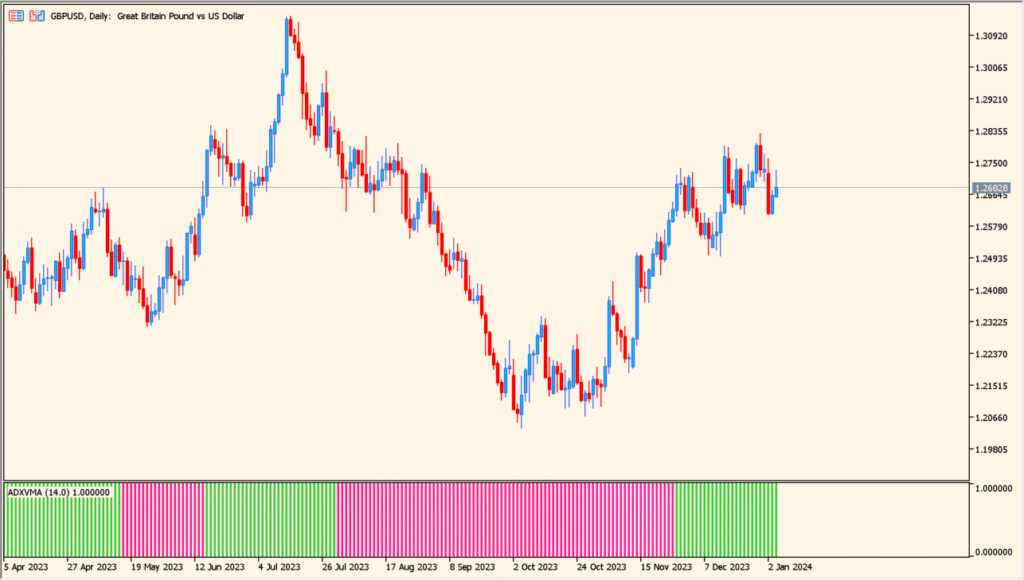
In real trading, this indicator is best used as a filter.
You can use it to avoid trading during weak or choppy conditions and focus only on periods where trend strength is present. It works well alongside trend-following strategies, breakouts, or moving average systems.
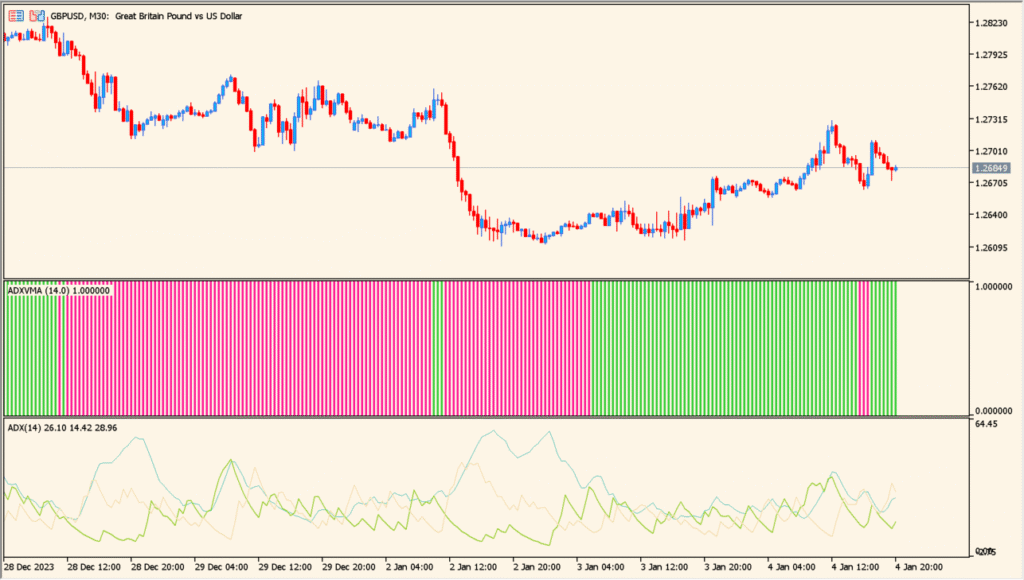
Because it does not show direction, it should be combined with price action or directional indicators. The histogram simply answers one question: is the market worth trading right now?
Parameters
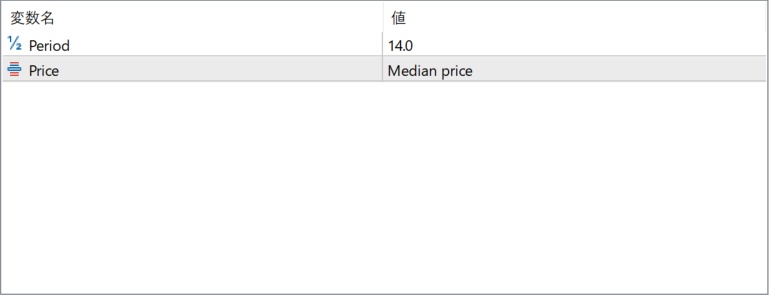
Period
Defines the calculation length used for the ADX-based smoothing. Shorter periods react faster to changes in strength, while longer periods provide a more stable view.
Price
Selects the price source used in the calculation, such as median price. Different price inputs slightly change the responsiveness of the histogram.