Indicator Overview
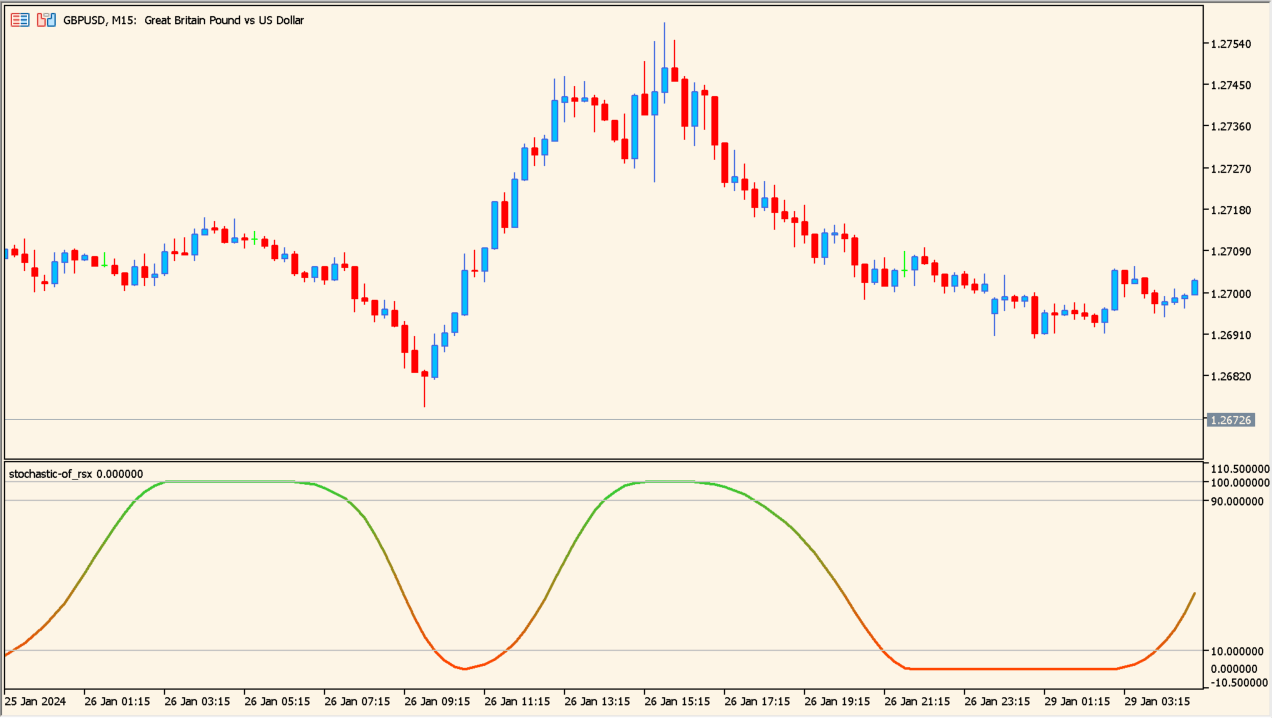
Stochastic of RSX is a momentum oscillator that applies the Stochastic calculation to the RSX (Relative Strength Xtra) indicator. By combining these two concepts, it produces a smoother and more stable oscillator than a traditional Stochastic, reducing whipsaws caused by short-term price noise.
The result is a momentum line that reacts to changes in market strength while maintaining a clean and readable structure, making it suitable for both trend-following and mean-reversion analysis.
How to Use It in Practice

In practice, this indicator is mainly used to assess momentum conditions rather than generate raw entry signals.
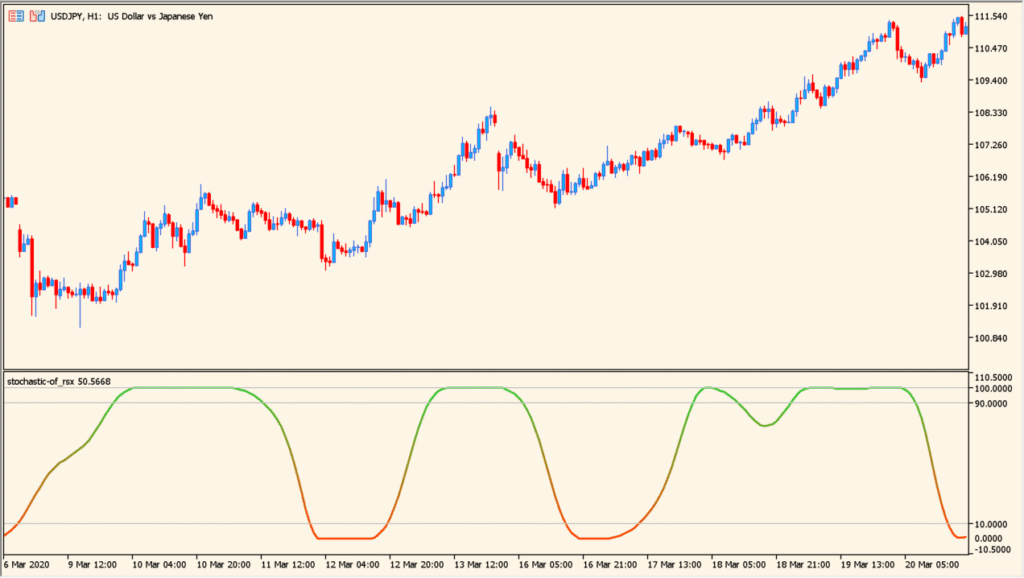
When the line stays in the upper zone, it reflects strong bullish momentum and supports trend continuation scenarios. Prolonged strength is often more meaningful here than brief overbought readings.
Moves into the lower zone indicate weakening or bearish momentum. In trending markets, these dips can help identify pullbacks rather than full reversals.
Crosses or direction changes near the mid-range can be useful for timing entries when combined with price action or higher-timeframe context.
Parameters
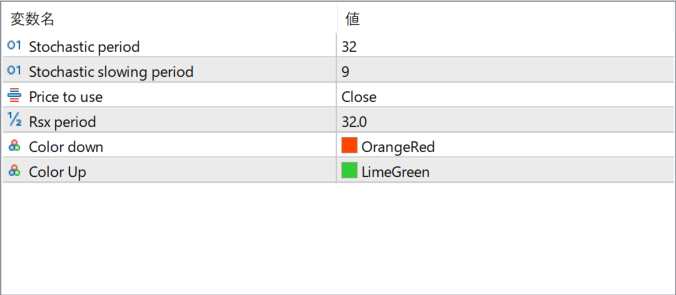
Stochastic period
Defines the lookback length used for the Stochastic calculation. Larger values smooth the oscillator and slow reactions, while smaller values make momentum changes appear faster.
Stochastic slowing period
Controls additional smoothing applied to the Stochastic output. Increasing this value reduces noise and creates a steadier line.
Price to use
Specifies which price value is used in the calculation, such as Close or other available price types.
Rsx period
Sets the calculation length for the RSX component. A longer period emphasizes broader momentum, while a shorter period focuses on short-term strength.
Color down
Defines the line color when momentum is declining.
Color Up
Defines the line color when momentum is rising.