Overview of the Indicator
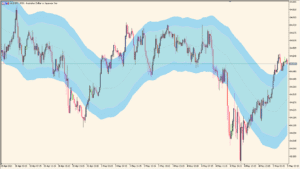
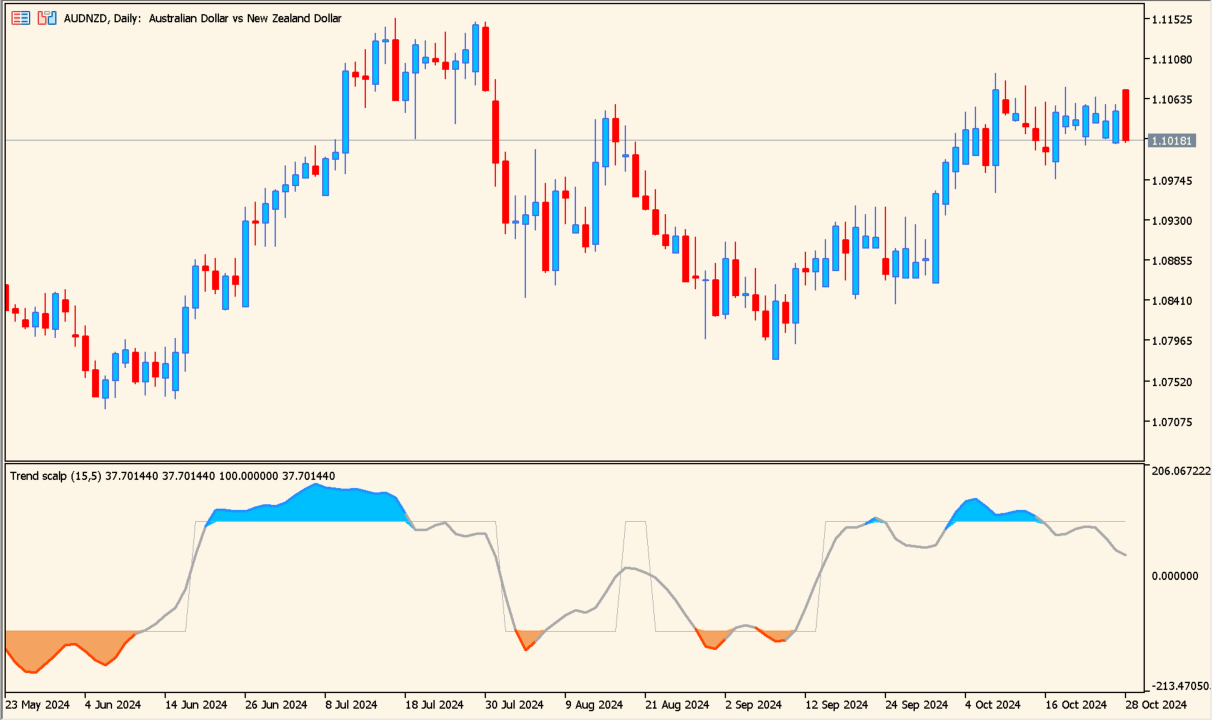
The trend-scalp-indicator is a short-term momentum tool built around the T3 smoothing method. It displays a histogram-style oscillator in a separate window, shifting between positive and negative zones to show directional pressure.
When the histogram is above the zero line, bullish momentum is dominant. When it is below zero, bearish pressure is stronger. The smoothing logic helps reduce noise, making it suitable for scalping on lower timeframes such as M1 or M5.
How to Use It in Practice
In live trading, the indicator can be used in the following ways:
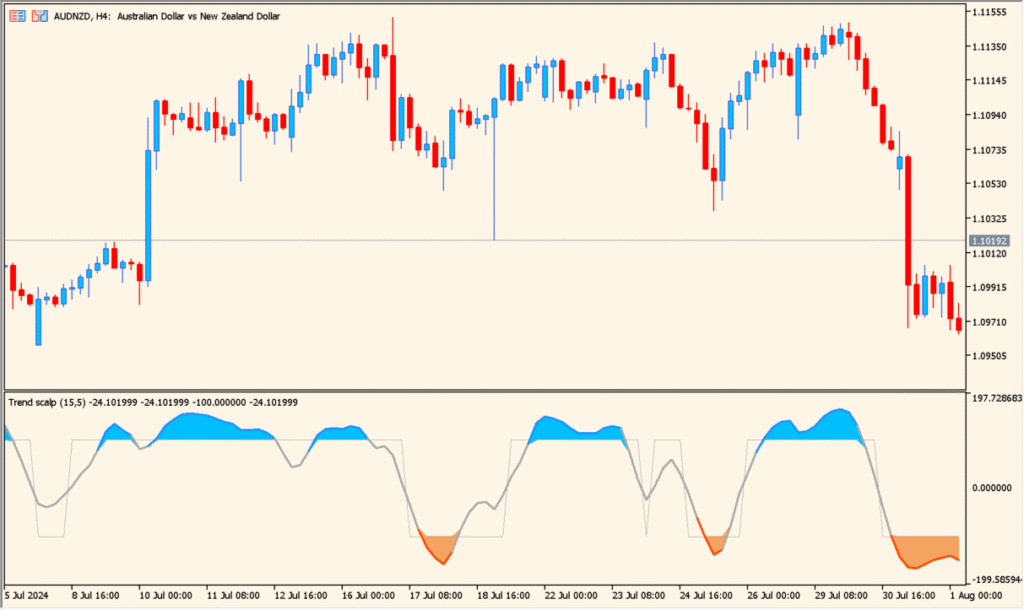
- Look for histogram crosses above the zero line as potential buy setups.
- Look for histogram crosses below the zero line as potential sell setups.
- Trade pullbacks in the direction of the dominant histogram color.
- Combine with a higher timeframe trend filter to avoid counter-trend entries.
Because it reacts quickly to price changes, it works best in active market sessions. Risk management is essential, especially on very short timeframes.
Parameters
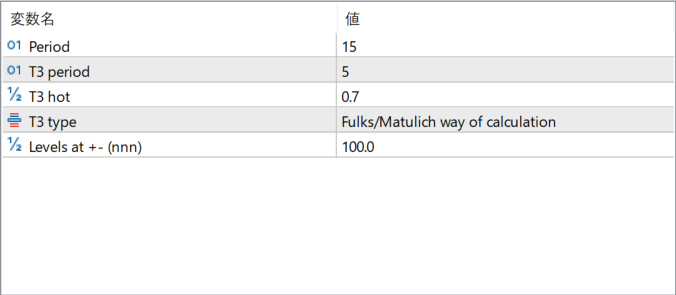
Period
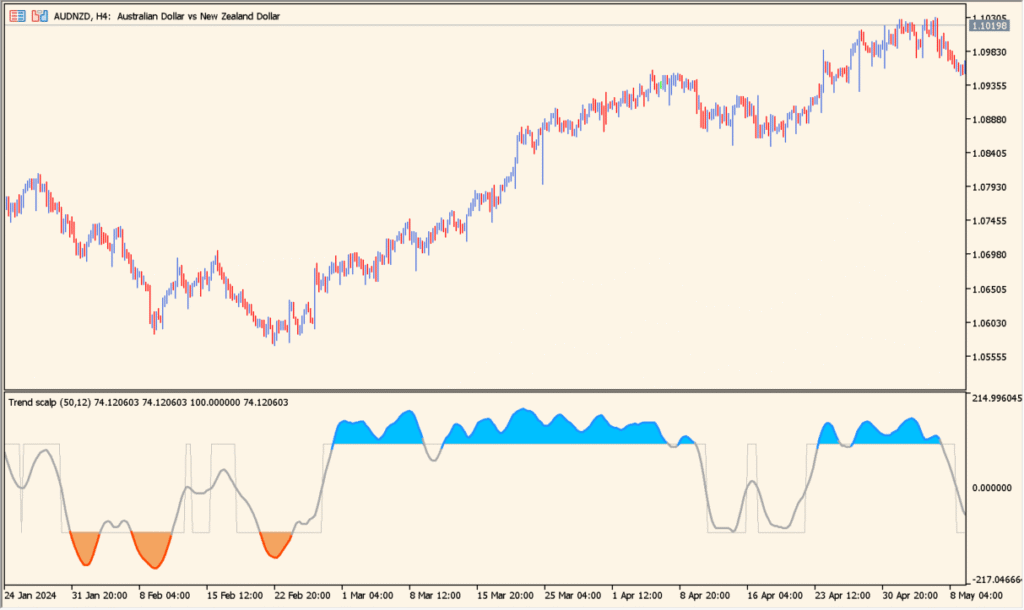
Defines the main calculation length. A smaller value increases sensitivity and generates faster signals, while a larger value smooths the movement and reduces signal frequency.
T3 period
Sets the smoothing length used in the T3 calculation. Higher values create a smoother curve, while lower values make the indicator more reactive.
T3 hot
Controls the T3 “hot” factor, which adjusts the responsiveness of the smoothing. Higher values increase responsiveness, while lower values produce a more stable output.
T3 type
Selects the calculation method for the T3 algorithm. Different calculation styles slightly change the smoothing behavior and signal timing.
Levels at +- (nnn)
Sets the positive and negative level thresholds. These levels can be used to identify overextended momentum conditions or strong trend phases.