Overview of the WATL Indicator
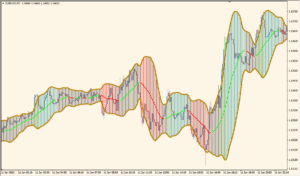
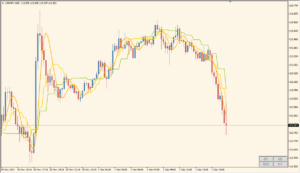
The WATL (Wide-Angle Trendlines) indicator for MT4 automatically plots three types of trendlines based on pivot points and trend structures. It is useful for identifying major and minor trend directions without manual drawing.
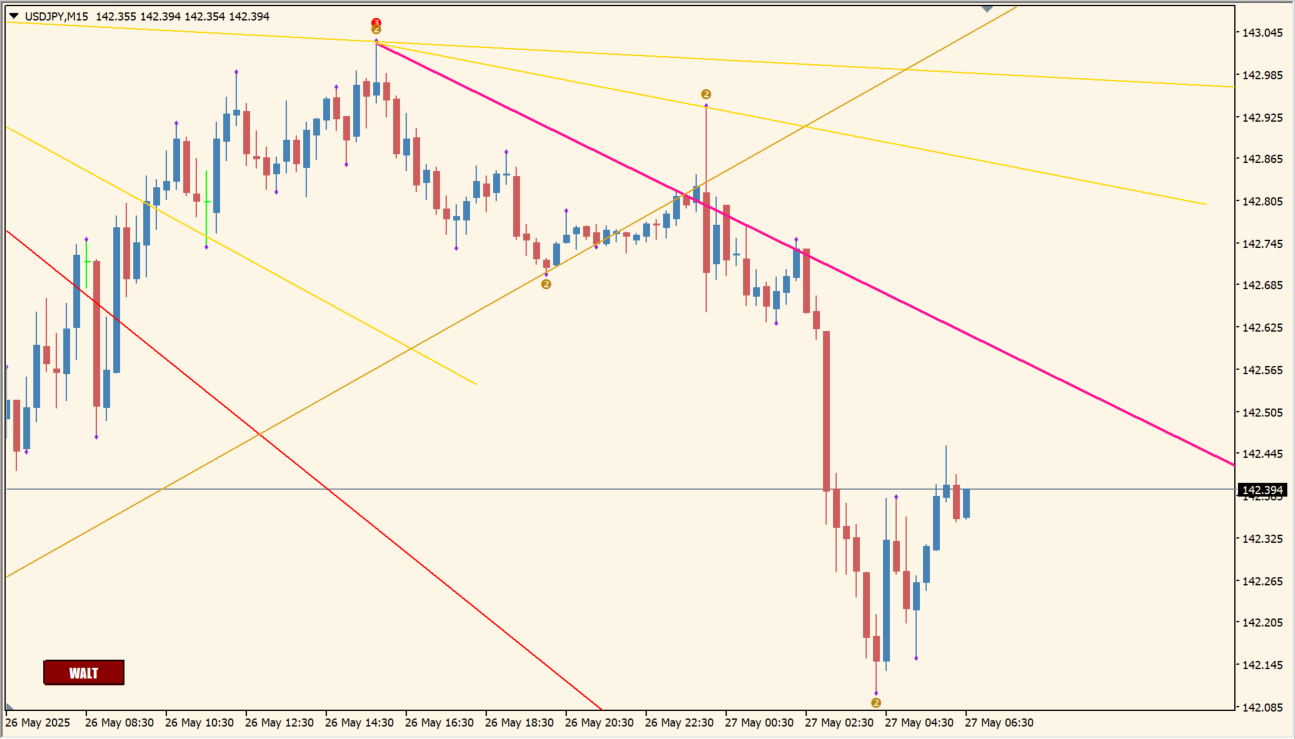
It draws the following trendlines:
- Red dashed line: Long-term trendline
- Yellow solid line: Short-term trendline
- Thick pink line: Currently respected trendline
You can toggle the visibility of these lines using the button displayed on the bottom left of the chart. This allows for a cleaner chart when needed.
How to Use It in Practice
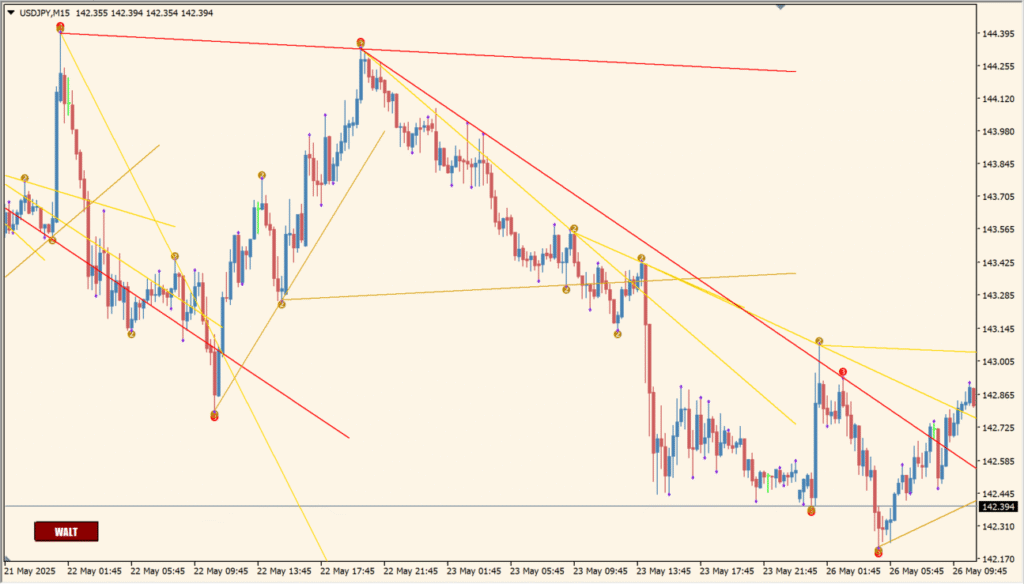
In actual trading, the WATL indicator helps you:
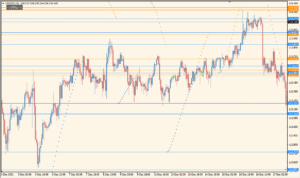
- Quickly identify key support and resistance zones based on auto-generated trendlines.
- Spot potential breakout or bounce zones around the currently respected pink trendline.
- Visually separate short-term moves from long-term structure with clearly colored lines.
- Use the button for clean screenshots or less cluttered decision-making.
Parameter Explanations
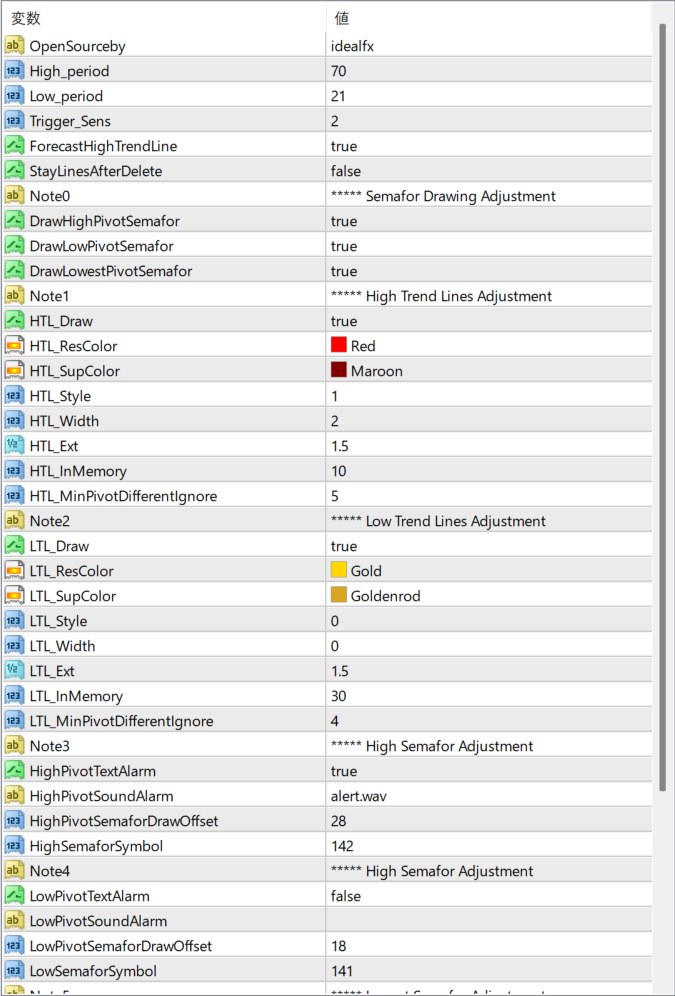
OpenSourceby
Author label or reference tag; does not affect functionality.
High_period
Pivot depth for detecting high points used in long-term trendlines.
Low_period
Pivot depth for detecting low points used in long-term trendlines.
Trigger_Sens
Sensitivity of semafor generation. Lower values make the indicator more reactive to recent price changes.
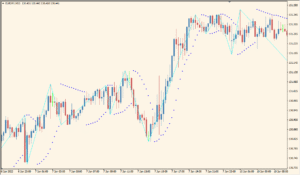
ForecastHighTrendLine
If true, the indicator projects future high trendlines based on current pivots.
StayLinesAfterDelete
If true, trendlines remain on the chart even after the indicator is removed.
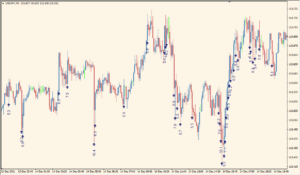
DrawHighPivotSemafor
Toggle for drawing semafor icons at high pivot points.
DrawLowPivotSemafor
Toggle for drawing semafor icons at low pivot points.
DrawLowestPivotSemafor
Enables drawing for the lowest-level pivot semafors.
HTL_Draw
Enables or disables long-term trendline drawing.
HTL_ResColor
Color of the resistance line in long-term trendlines.
HTL_SupColor
Color of the support line in long-term trendlines.
HTL_Style
Line style for long-term trendlines (solid, dashed, etc.).
HTL_Width
Line thickness for long-term trendlines.
HTL_Ext
Length of trendline extension beyond pivot points.
HTL_InMemory
Number of candles to keep the long-term trendlines active on screen.
HTL_MinPivotDifferentIgnore
Minimum difference required between pivot highs/lows to draw a valid line.
LTL_Draw
Enables or disables short-term trendline drawing.
LTL_ResColor
Color of the resistance line in short-term trendlines.
LTL_SupColor
Color of the support line in short-term trendlines.
LTL_Style
Line style for short-term trendlines.
LTL_Width
Line thickness for short-term trendlines.
LTL_Ext
Length of trendline extension for short-term lines.
LTL_InMemory
How many candles short-term lines stay active on the chart.
LTL_MinPivotDifferentIgnore
Minimum difference in price to filter out weak pivots in short-term analysis.
HighPivotTextAlarm
Enables text alert when a high semafor is formed.
HighPivotSoundAlarm
Plays a sound when a high semafor is detected.
HighPivotSemaforDrawOffset
Adjusts vertical offset for high semafor icons.
HighSemaforSymbol
Symbol code used for high pivot semafor.
LowPivotTextAlarm
Enables text alert when a low semafor is formed.
LowPivotSoundAlarm
Sound file to play for low semafor alert.
LowPivotSemaforDrawOffset
Adjusts the display offset for low semafor icons.
LowSemaforSymbol
Symbol code used for low pivot semafor.