Overview of the WATL-Open Source button Indicator
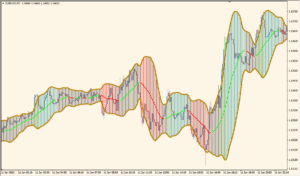
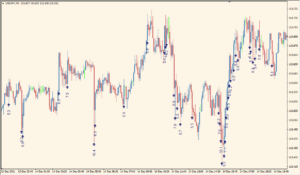
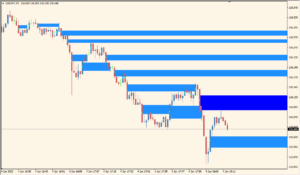
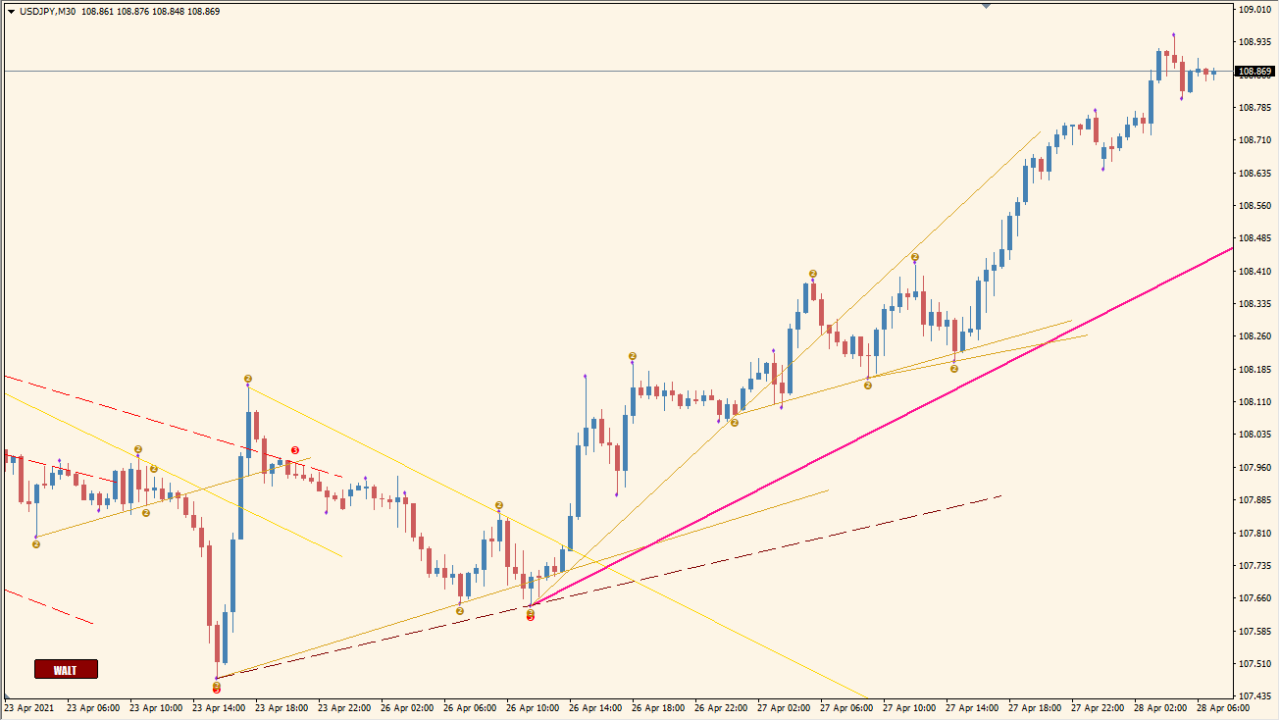
The WATL-Open Source button indicator is a custom MT4 tool designed to highlight key pivot points and trend lines using the semafor method. It marks high and low pivots with different-sized dots and draws trendlines to visualize the market structure. The indicator can also alert users to potential trend reversals or continuations based on configurable sensitivity and thresholds.
It’s useful for traders who rely on visual swing analysis and want to catch early trend formation or potential exhaustion zones. The additional option to forecast trendlines and use alert sounds makes it a versatile tool for both manual and semi-automated trading strategies.
How to Use It in Practice

In live trading, you can use this indicator to:
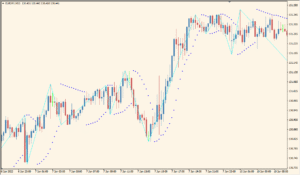
- Identify high and low pivot points with visual markers (semafors).
- Follow trendlines automatically drawn between important pivots.
- Receive alerts when new high or low semafor points are formed.
- Forecast potential trendline directions before they are confirmed.
- Customize the sensitivity and visibility of semafor points for different timeframes or trading styles.
This indicator is well-suited for discretionary traders who use chart structure and pivot recognition in their strategies.
Parameter Explanations
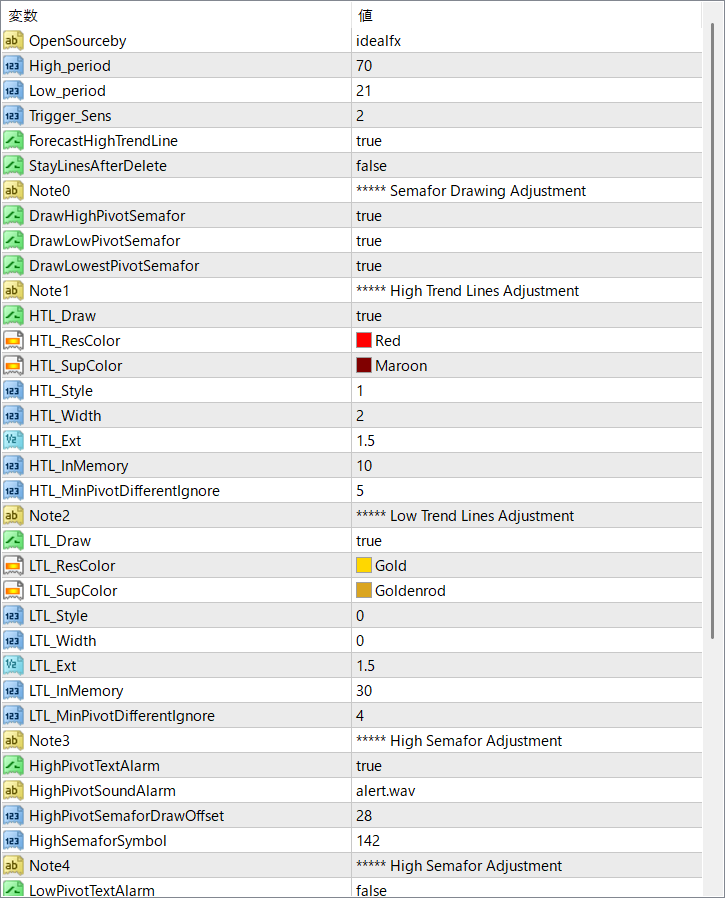
OpenSourceby
Name of the developer or source attribution. No functional impact.
High_period
Period used to calculate high pivot points. Larger values reduce sensitivity, showing fewer signals.
Low_period
Period used to calculate low pivot points. Functions the same way as High_period but for lows.
Trigger_Sens
Sensitivity setting for triggering semafor signals. Lower values increase the number of signals.
ForecastHighTrendLine
Enables drawing of forecasted trendlines from high pivots.
StayLinesAfterDelete
Determines whether trendlines stay on chart after deleting the indicator.
DrawHighPivotSemafor
Enables drawing of semafor dots at high pivot points.
DrawLowPivotSemafor
Enables drawing of semafor dots at low pivot points.
DrawLowestPivotSemafor
Shows the lowest-level semafor point for extra confirmation.
HTL_Draw
Turns on or off the drawing of high trendlines.
HTL_ResColor
Color used for resistance (high) trendlines.
HTL_SupColor
Color used for support trendlines, even if drawn from highs.
HTL_Style
Line style for high trendlines (solid, dashed, etc.).
HTL_Width
Line thickness for high trendlines.
HTL_Ext
Specifies how far the trendline is extended visually.
HTL_InMemory
Defines how many past bars to consider for trendline drawing.
HTL_MinPivotDifferentIgnore
Filters out pivot points that are too close together, reducing noise.
LTL_Draw
Enables or disables drawing of low trendlines.
LTL_ResColor
Color for resistance lines drawn from low pivots.
LTL_SupColor
Color for support lines drawn from low pivots.
LTL_Style
Line style used for low trendlines.
LTL_Width
Line thickness for low trendlines.
LTL_Ext
Length extension of the low trendline.
LTL_InMemory
Controls how much historical data is used for low pivots.
LTL_MinPivotDifferentIgnore
Minimum difference filter for low pivots to prevent over-drawing.
HighPivotTextAlarm
Turns on a text alert when a high semafor appears.
HighPivotSoundAlarm
Plays a sound alert when a high pivot is detected.
HighPivotSemaforDrawOffset
Controls the vertical offset of the high semafor marker from the candle.
HighSemaforSymbol
Symbol used to represent a high semafor on the chart (e.g., number or shape).
LowPivotTextAlarm
Turns on a text alert when a low semafor appears.