Indicator Overview

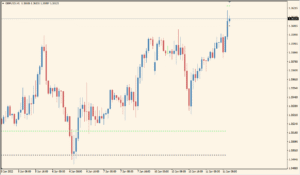
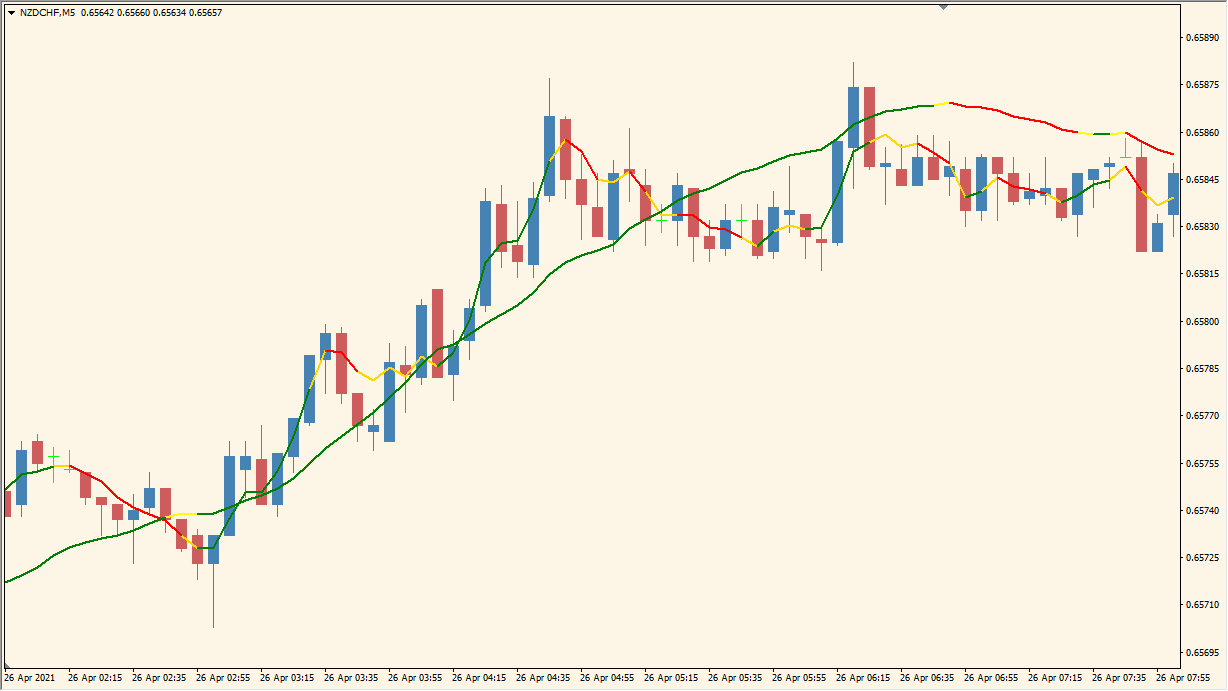
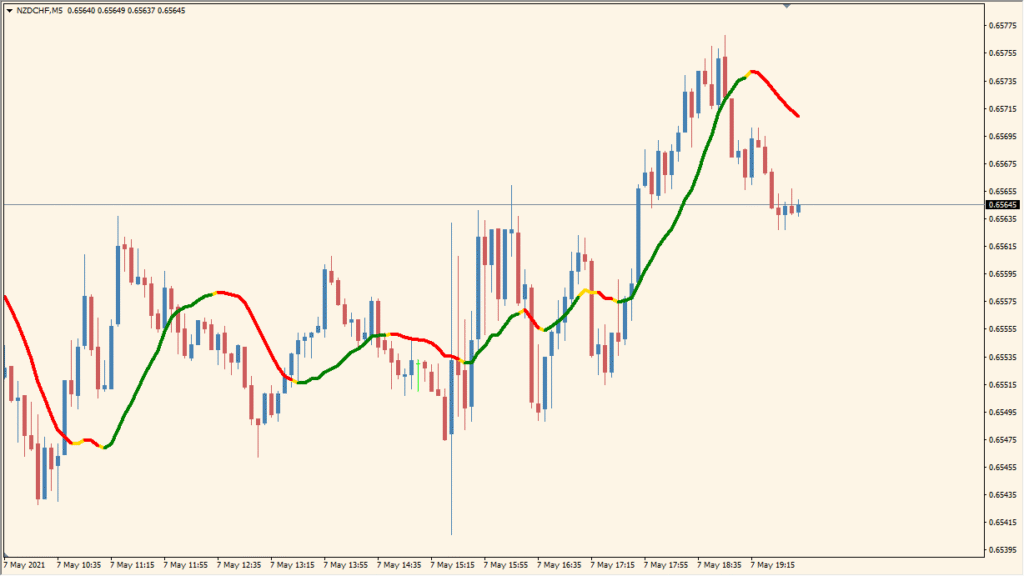
The LSMA in Color indicator for MT4 is a Linear Regression Moving Average (Least Squares Moving Average) that visually highlights trend direction by color. When the trend is bullish, the LSMA line is green; when bearish, it turns red. This makes it easy to spot momentum shifts at a glance without manually analyzing trend slopes.
It’s especially useful for traders who prefer a clean chart with trend confirmation. The LSMA reacts smoothly to price changes, helping to reduce noise while still showing the underlying market direction.
How to Use It in Practice
You can use the LSMA in Color indicator to:
- Confirm trend direction visually (green for uptrend, red for downtrend).
- Avoid trading against the trend during choppy markets.
- Combine with other indicators like RSI or support/resistance for entry/exit decisions.
- Use it as a trend filter for automated or manual trading strategies.
It’s particularly helpful on higher timeframes (H1 and above) to reduce false signals from small price fluctuations.
Parameter Explanations
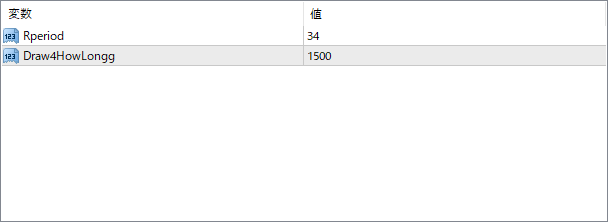
Rperiod
Defines the number of bars used to calculate the LSMA. Higher values make the line smoother and less reactive to short-term price changes.
Draw4HowLongg
Sets how many historical bars the LSMA line should be drawn on. Increasing this can give a longer visible trend line on the chart.