Overview of the Gann Square Indicator
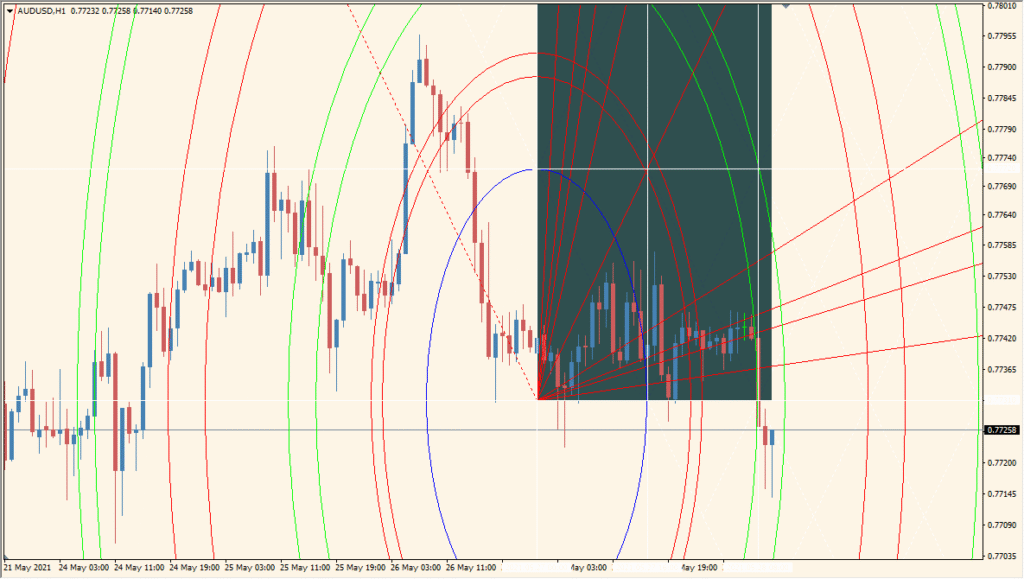
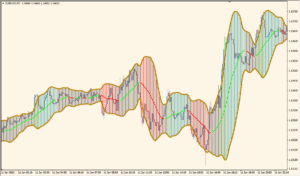
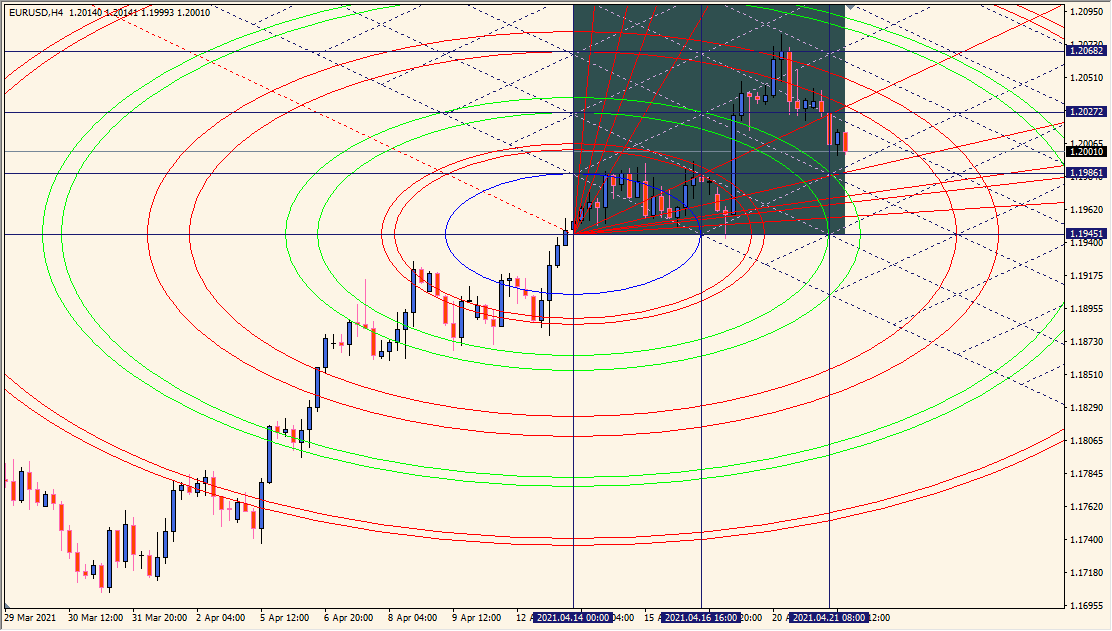
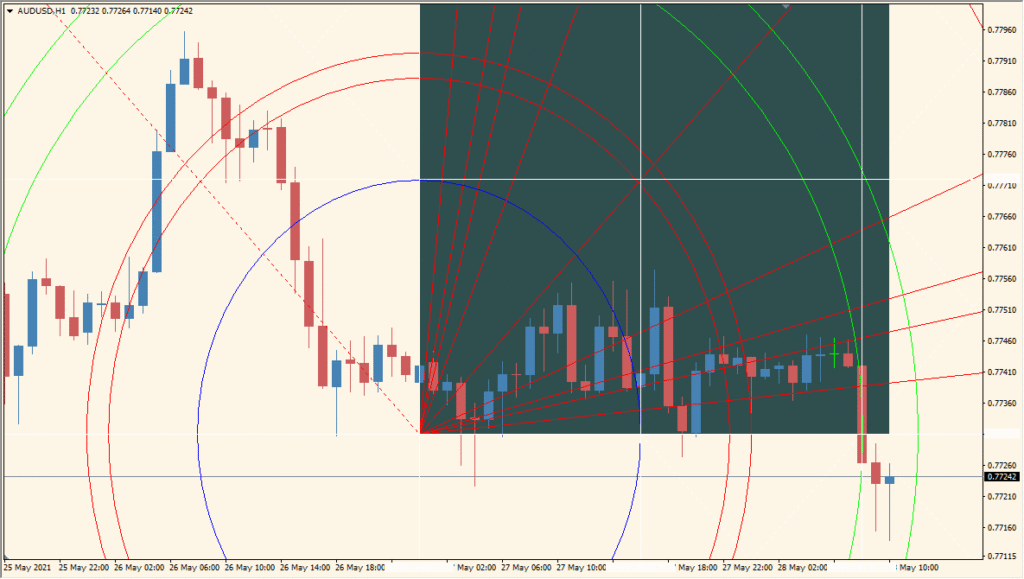
The Gann Square Indicator for MT4 visually projects Gann-based time and price relationships onto the chart using square grids, arcs, and fan lines. It’s designed to help traders identify balanced zones where time and price may align, potentially signaling turning points. This tool blends geometry with historical price action, offering a unique way to anticipate market reactions.
By drawing symmetrical structures such as squares and spirals, it allows users to forecast potential support/resistance levels and key timing areas. Ideal for users familiar with Gann theory or those looking to explore time-price harmonics.
How to Use It in Practice
In practice, traders use this indicator to:
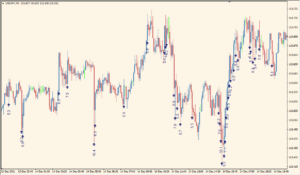
- Identify symmetrical price/time setups based on Gann’s theory.
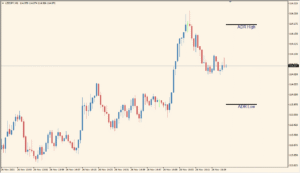
- Mark significant support/resistance levels using arcs and box levels.
- Forecast possible trend reversals using Gann fan angles.
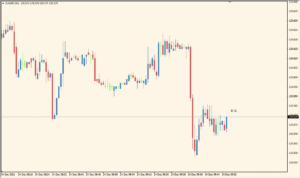
- Customize scale and square size to fit specific assets or timeframes.
This indicator suits advanced traders or those experimenting with geometry-based technical analysis.
Parameter Explanations
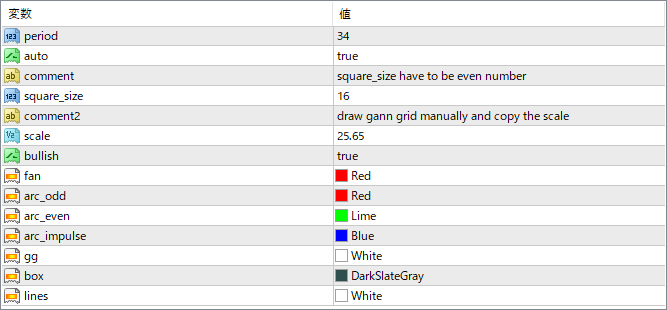
period
Defines the historical data range used to base the Gann grid. A longer period extends the indicator’s visual coverage.
auto
When set to true, it enables automatic grid adjustment based on chart zoom and structure.
square_size
Sets the number of squares along each side of the main grid. Must be an even number for symmetry.
scale
Adjusts the vertical/horizontal ratio of the grid. Affects spacing of lines and arcs.
bullish
If true, the structure assumes a bullish layout. Useful for inverting the view for bearish markets.
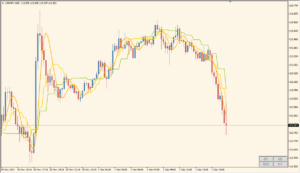
fan
Color of the Gann fan lines that project angles (like 1×1, 1×2). Helps define potential trend paths.
arc_odd
Color of arcs drawn for odd-numbered square levels (e.g., 1, 3, 5).
arc_even
Color of arcs drawn for even-numbered square levels (e.g., 2, 4, 6).
arc_impulse
Color of the arc used to mark the impulse move from the selected range. Acts as a visual cue for strong movement.
gg
Color of grid guidelines that form the square structure.
box
Color of the square box drawn to represent the time/price square area.
lines
Color of horizontal and vertical lines for structure reference.