Overview of the Grail Indic Indicator
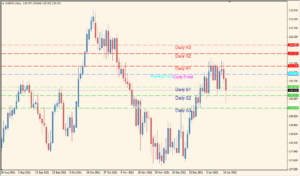
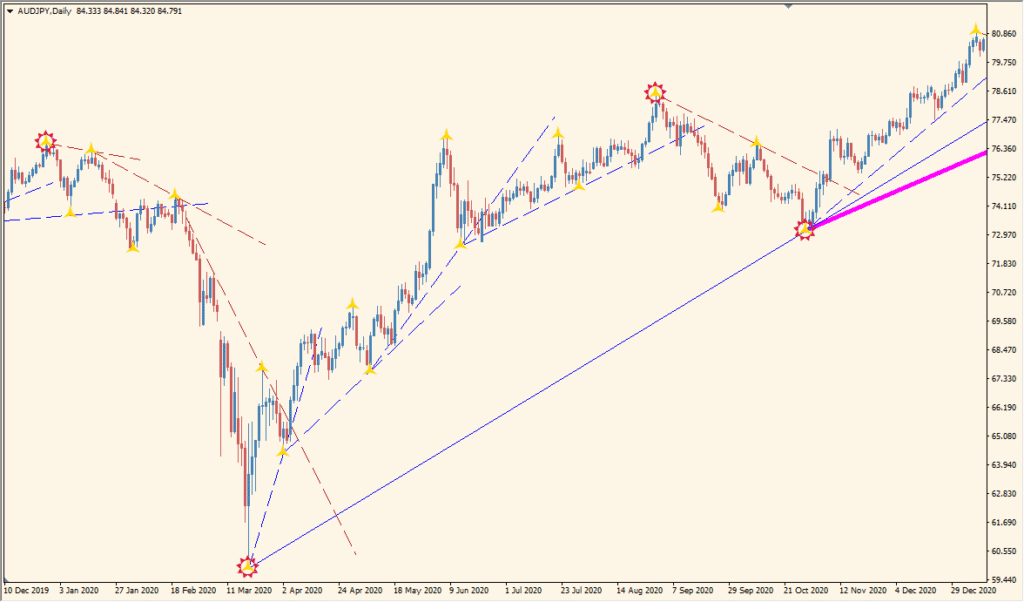
The Grail Indic indicator for MT4 is a multi-functional tool that combines semafor-based pivot detection with trendline projection and Fibonacci retracement visualization. It helps traders identify potential swing highs and lows, detect key support/resistance areas, and anticipate future price movements using trendlines and dynamic alerts.
The indicator plots visual pivot points using semafor logic and automatically draws high and low trendlines. It also offers options for sound alerts, symbol marking, and conditional filtering to refine signal quality. It’s especially useful for swing traders and trend followers looking to map out market structure more clearly.
How to Use It in Practice
In live trading, the Grail Indic indicator can be used to:
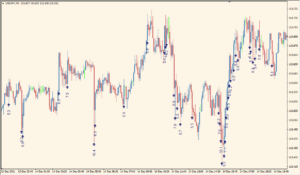
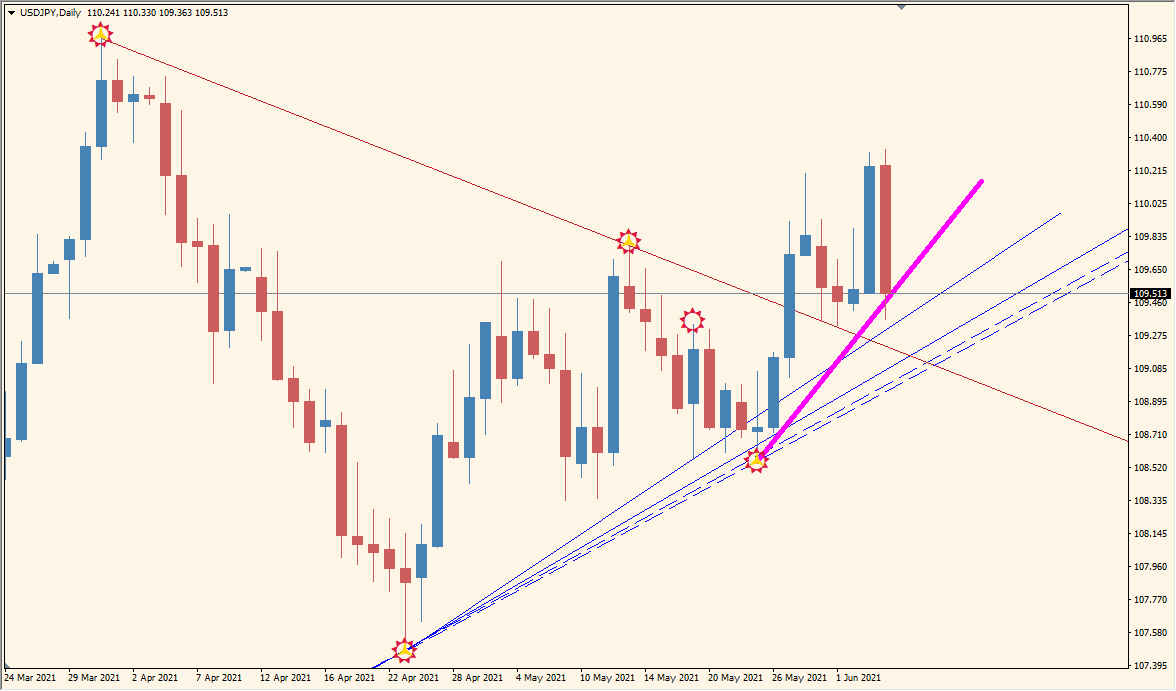
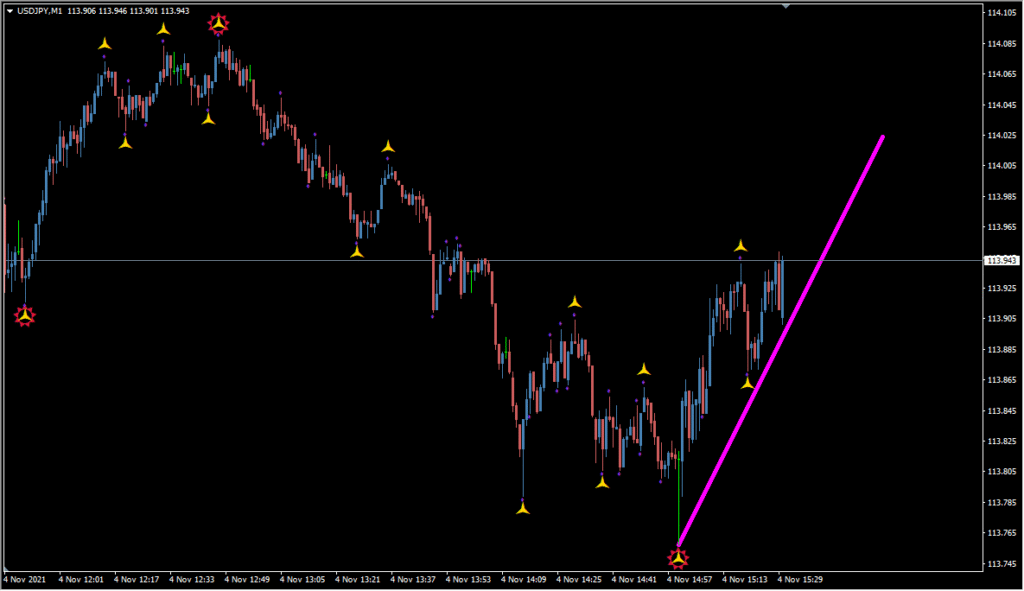
- Spot major swing highs and lows with visual symbols.
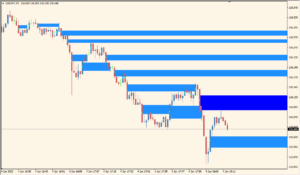
- Draw automatic high/low trendlines for better structure analysis.
- Use Fibonacci projections from recent pivots to set target zones.
- Receive alerts and audio cues when significant pivot points form.
- Enhance your strategy with visual support/resistance and trend confluence.
Parameter Explanations
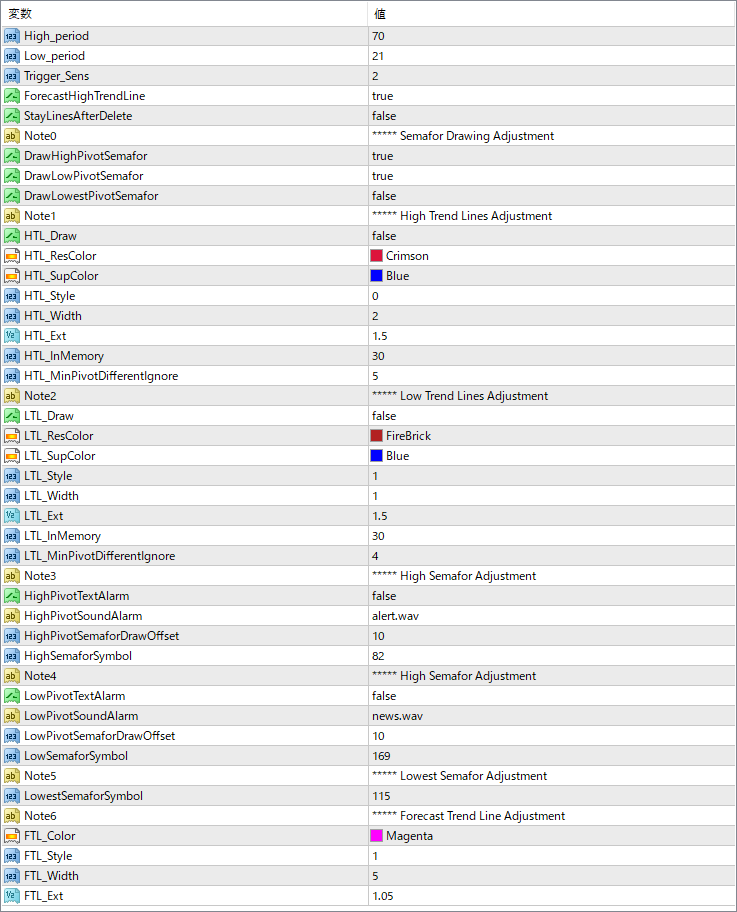
High_period
Sets the sensitivity for detecting major high pivots.
Low_period
Sets the sensitivity for detecting major low pivots.
Trigger_Sens
Controls how sensitive the trigger is for drawing pivot signals.
ForecastHighTrendLine
If true, draws a projected trendline from recent high pivots.
StayLinesAfterDelete
If false, removes trendlines when the indicator is removed or refreshed.
DrawHighPivotSemafor
If true, displays semafor icons on high pivot points.
DrawLowPivotSemafor
If true, displays semafor icons on low pivot points.
DrawLowestPivotSemafor
If true, shows the lowest pivot points with a unique symbol.
HTL_Draw
If true, enables drawing of high trendlines based on pivots.
HTL_ResColor
Sets the color of high resistance trendlines.
HTL_SupColor
Sets the color of high trendline supports.
HTL_Style
Defines the line style for high trendlines.
HTL_Width
Defines the line thickness of high trendlines.
HTL_Ext
Specifies how far the trendline is projected into the future.
HTL_InMemory
Sets how many pivot points are stored and analyzed.
HTL_MinPivotDifferentIgnore
Ignores pivots that are too close in price to previous ones.
LTL_Draw
If true, enables drawing of low trendlines.
LTL_ResColor
Sets the color of low trendline resistance.
LTL_SupColor
Sets the color of low trendline support.
LTL_Style
Defines the line style for low trendlines.
LTL_Width
Sets the width of low trendlines.
LTL_Ext
Sets how far the low trendlines extend forward.
LTL_InMemory
Defines how many low pivots are kept for analysis.
LTL_MinPivotDifferentIgnore
Filters out nearby pivots that may not be structurally significant.
HighPivotTextAlarm
Enables or disables textual alert when high pivots appear.
HighPivotSoundAlarm
Specifies the sound file to play on high pivot signal.
HighPivotSemaforDrawOffset
Vertical offset for semafor symbols on high pivots.
HighSemaforSymbol
Symbol code used to mark high semafor pivot points.
LowPivotTextAlarm
Enables or disables text alert for low pivots.