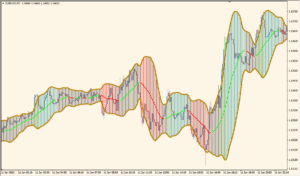
Overview of the Point Figure Indicator

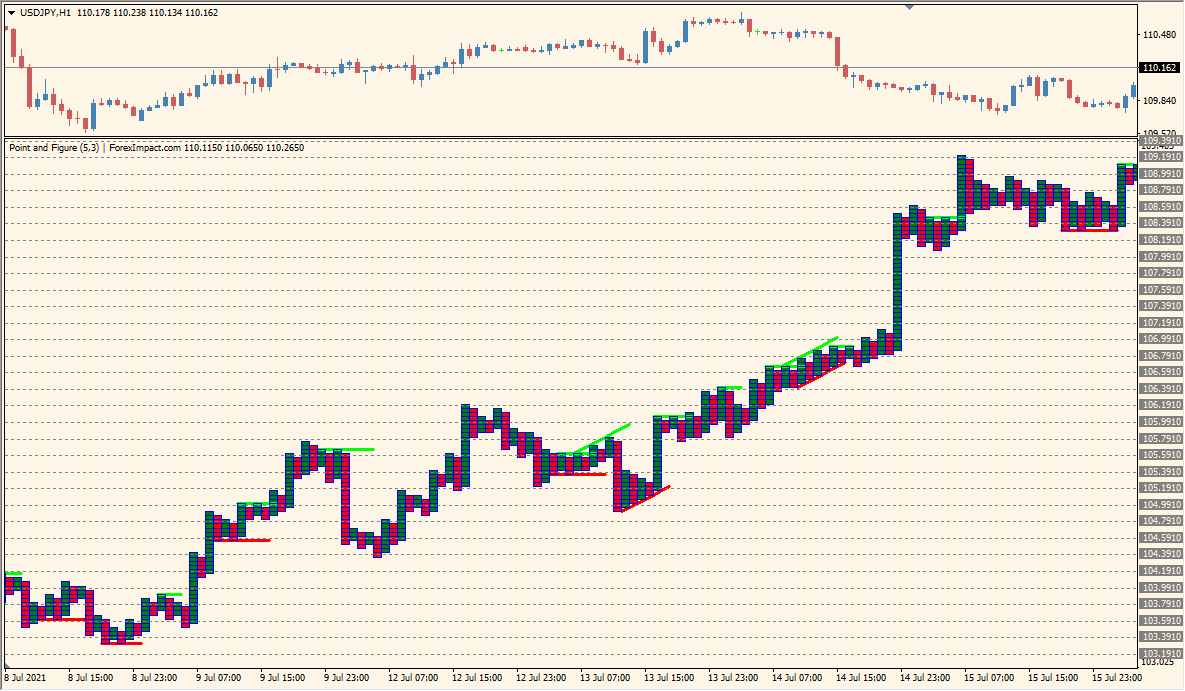
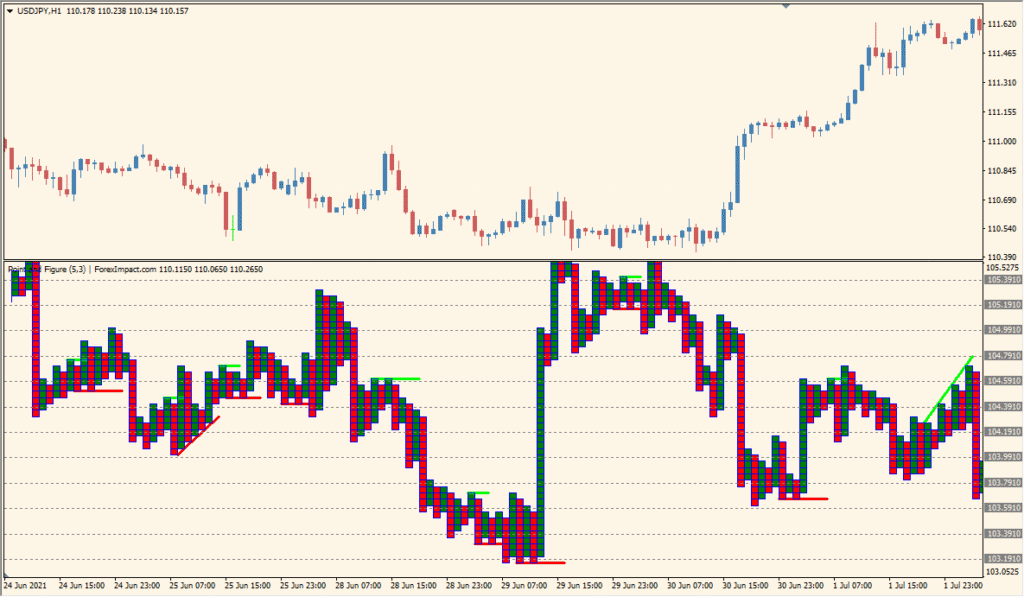
The Point Figure indicator for MT4 creates a chart style that focuses purely on price movements, ignoring time and volume. This method filters out market noise and helps traders identify clear support and resistance levels, breakouts, and trends with a different perspective. It’s especially useful for those who prefer to focus solely on price action without being distracted by time-based candles.
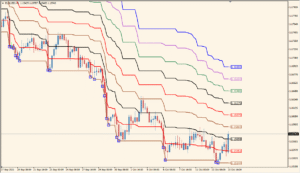
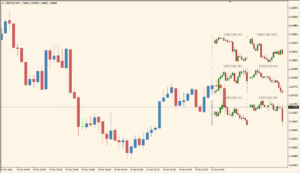
The chart is made up of columns of Xs and Os (represented here with colored blocks), where each column changes direction only after price has reversed by a predefined amount. This makes the chart clean and highlights major price moves.
How to Use It in Practice
In practice, the Point Figure indicator can help traders:
- Spot clear breakouts without time-based noise.
- Identify support and resistance areas with higher accuracy.
- Visualize trend direction with minimal distractions.
- Build strategies based on pure price action logic.
This charting method is ideal for swing traders, long-term traders, or anyone who wants to simplify their analysis and cut through the clutter of candlestick noise.
Parameter Explanations
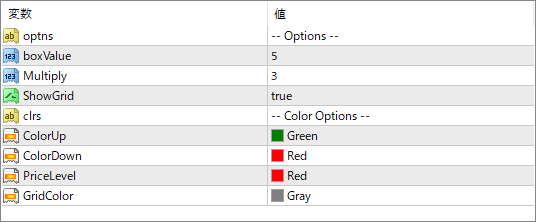
optns
Option selector for different visual or calculation styles, if supported by the indicator logic.
boxValue
Defines the box size (price unit) used to determine when a new X or O is plotted. A smaller value results in more detail; a larger value filters more noise.
Multiply
Specifies the reversal amount in multiples of the box size. This controls how much price must move in the opposite direction to start a new column.
ShowGrid
Turns the background grid lines on or off for better visual alignment.
ColorUp
Color used for upward price movement blocks (e.g., green columns).
ColorDown
Color used for downward price movement blocks (e.g., red columns).
PriceLevel
Color for horizontal price level lines on the chart.
GridColor
Color of the background grid lines, if enabled.