Overview of the MZZ9_trendLine_SR Indicator

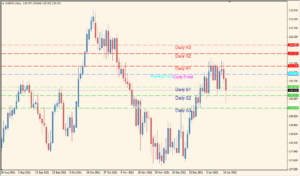
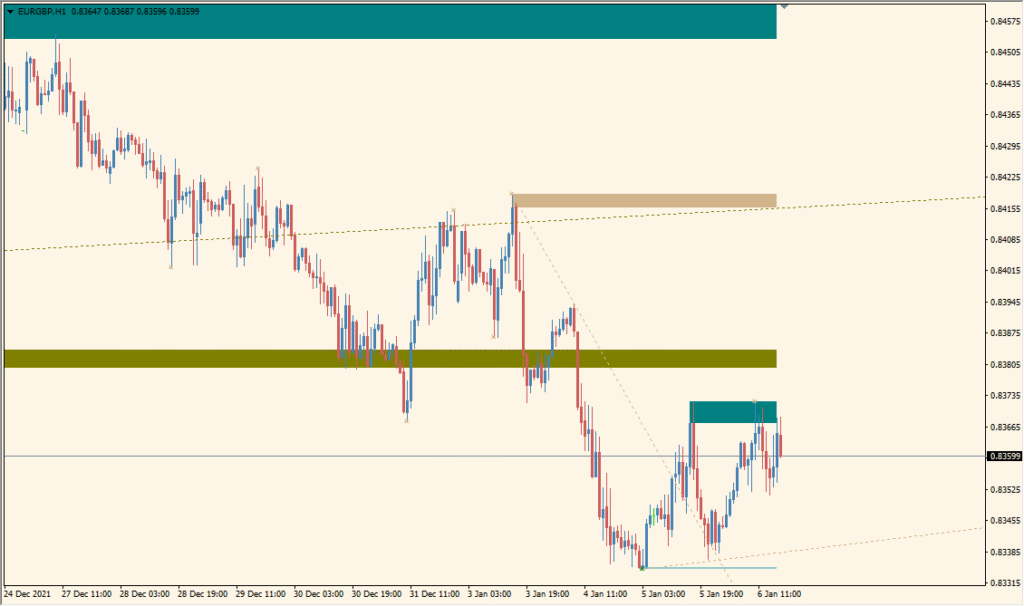
The MZZ9_trendLine_SR indicator combines automatic trendline drawing with support and resistance zone detection. It uses the ZigZag structure and configurable depths to highlight significant highs/lows and extends these as dynamic trendlines. In addition, it plots price zones that may act as future S&R areas.
It is useful for traders looking for a systematic way to identify structural price levels and potential breakout or bounce zones. The indicator is flexible and supports multi-color, multi-line displays with configurable Fibonacci zones and styling.
How to Use It in Practice
In trading, MZZ9_trendLine_SR can be used to:
- Automatically detect and visualize key trendlines based on historical price swings.
- Mark areas of potential support or resistance using colored zones.
- Use the trendlines as confluence points with other technical indicators.
- Apply Fibonacci-based levels to anticipate retracements or extensions.
This indicator is ideal for swing traders and technical analysts who want clean, automatic structure levels on the chart without drawing them manually.
Parameter Explanations
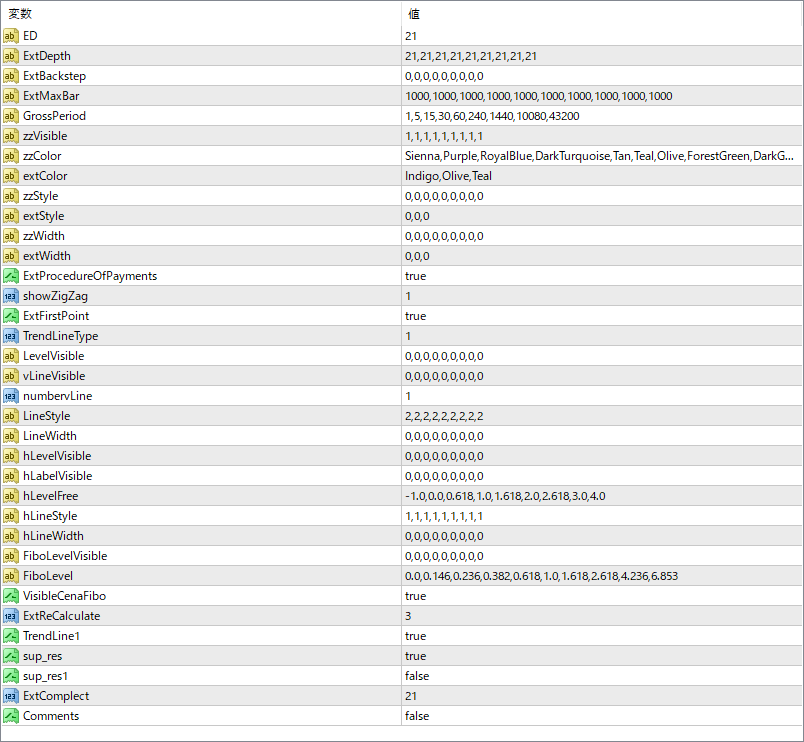
ED
Specifies the ZigZag depth setting used to detect major swing highs and lows for trendline plotting.
ExtDepth
A list of ZigZag depth values used in multi-layer calculations. Each entry affects the level of detail drawn.
ExtBackstep
Sets the number of bars to ignore before confirming a swing point. Helps reduce noise.
abtMaxBar
Controls how far back the indicator searches for structural points on the chart.
GrossPeriod
Timeframe parameters for calculating multi-timeframe trendlines or levels.
zzVisible
Defines which ZigZag levels are shown on the chart. Each 1 or 0 enables or disables a layer.
zzColor
Color configuration for the ZigZag lines by depth layer.
extColor
Color for the extended trendlines.
zzStyle
Line style settings for the ZigZag lines.
extStyle
Style setting for the extended trendlines.
zzWidth
Line thickness for the ZigZag lines.
extWidth
Line thickness for the extended trendlines.
ExtProcedureOfPayments
Internal flag for processing additional drawing logic. Typically left enabled.
showZigZag
If true, ZigZag structure lines are drawn.
ExtFirstPoint
When true, trendline drawing starts from the very first valid point found.
TrendLineType
Defines how trendlines are drawn — by angle, slope, or fixed logic (based on coded setting).
LevelVisible
Controls visibility of the support/resistance zones by level.
VLineVisible
If true, vertical reference lines will appear.
numberLine
Specifies how many trendlines to draw per ZigZag structure.
LineStyle
Style of each individual trendline (dotted, dashed, etc.).
LineWidth
Thickness of the trendlines.
hLevelVisible
Controls which horizontal support/resistance zones are visible.
hLabelVisible
If true, text labels will be shown for the S/R zones.
hLevelFree
Custom Fibonacci ratio levels for zone drawing. Allows personalized level settings.
hLineStyle
Style of horizontal support/resistance lines.
hLineWidth
Thickness of the horizontal lines.
FilterLevelVisible
Logic filter to decide if a level should be drawn or not. Helps reduce clutter.