Overview of the CCI Angle Indicator
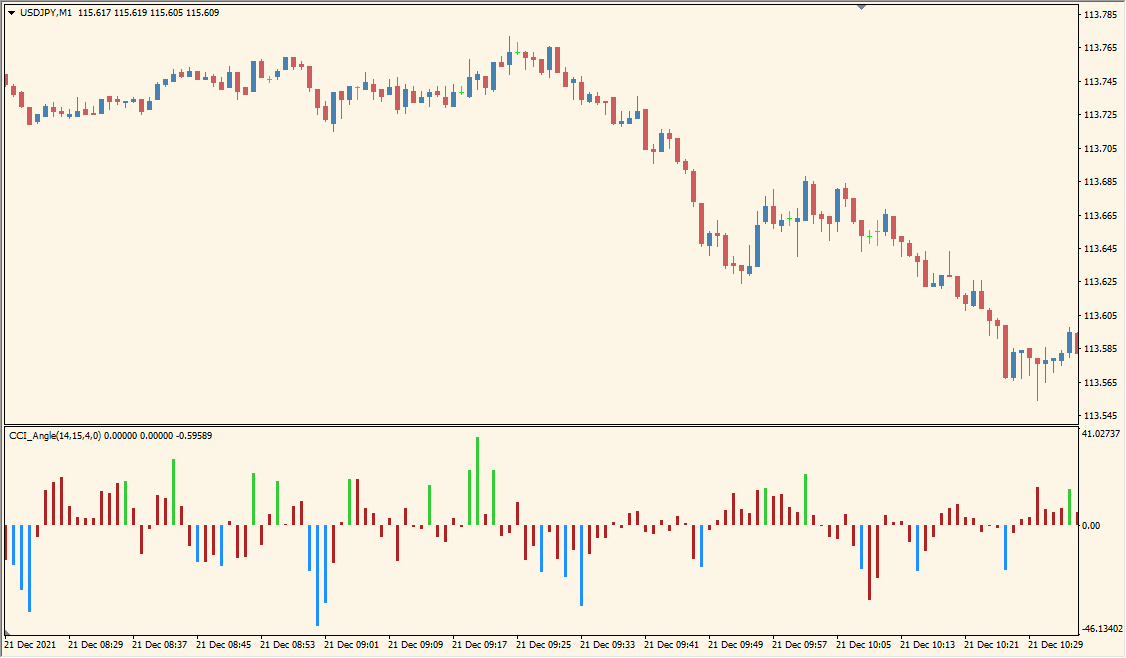
The CCI Angle indicator is a variation of the Commodity Channel Index (CCI) that focuses on the angle or slope of the CCI line, rather than its absolute value. It helps identify the strength and direction of a trend by calculating the angle between the current and previous CCI values. When the angle exceeds a certain threshold, it suggests a stronger trend momentum, which can be useful for confirming entry or exit signals.
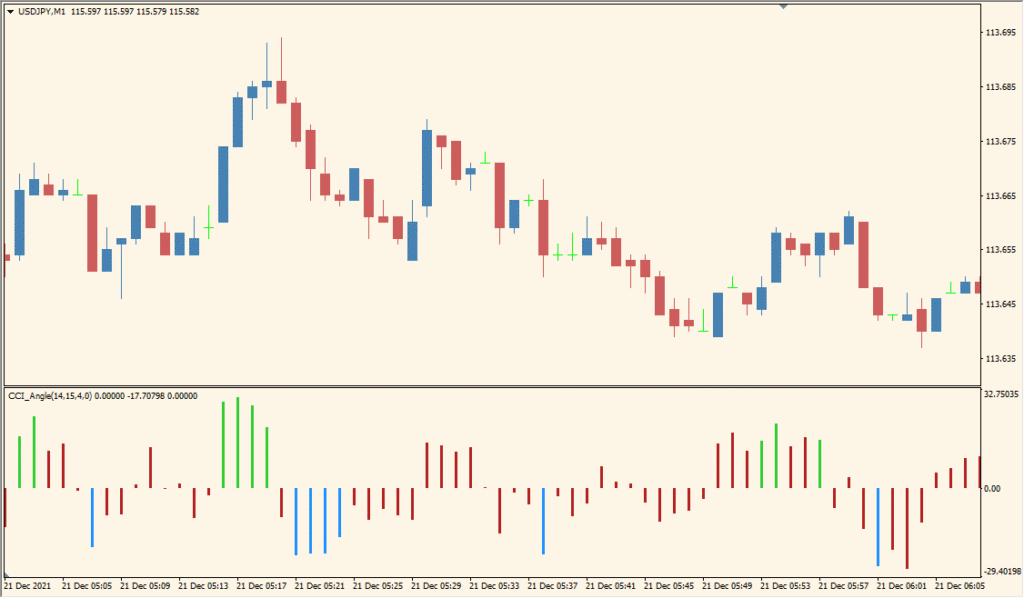
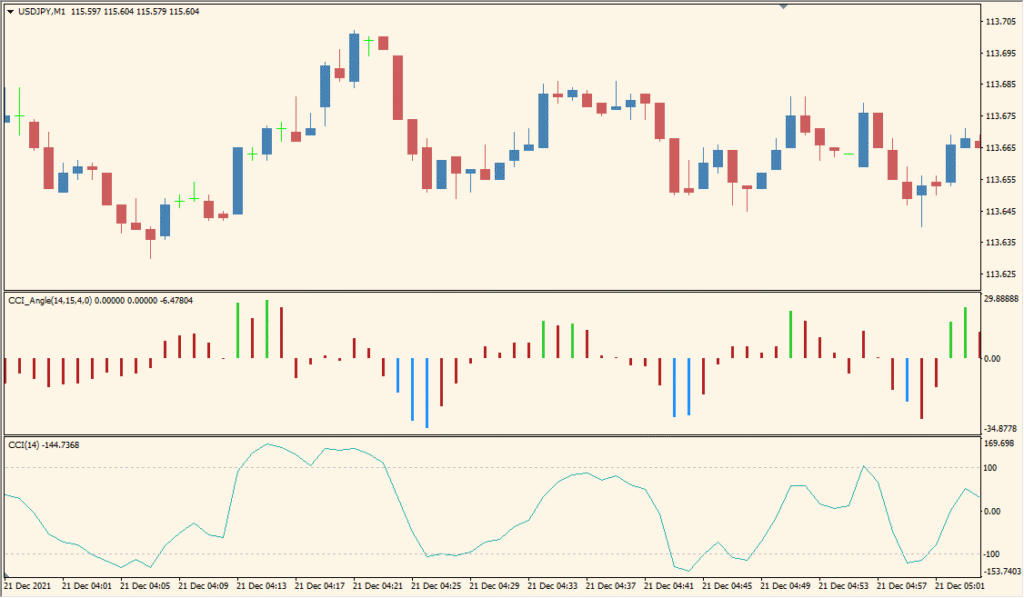
The indicator is displayed as a histogram below the chart. Green bars typically indicate strong upward momentum, red bars show downward momentum, and other colors (such as yellow) suggest weaker or transitioning momentum.
How to Use It in Practice
In live trading, the CCI Angle indicator can help traders:
- Gauge the strength of a trend based on the steepness of CCI movements.
- Filter out weak or sideways markets by setting a threshold for the angle.
- Confirm trend entries when the angle exceeds the threshold level.
- Identify potential trend reversals when the histogram bars change color or cross the zero line.
It’s most effective when used in combination with other trend-following indicators or price action patterns to confirm momentum.
Parameter Explanations
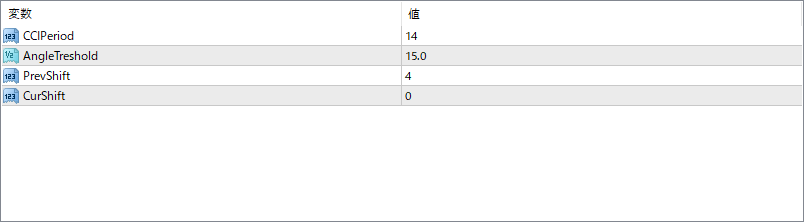
CCIPeriod
Sets the number of periods used to calculate the base CCI. A shorter period makes the angle more responsive but also more sensitive to noise.
AngleTreshold
Defines the minimum angle value needed to highlight significant momentum. Bars only change color when the CCI angle exceeds this threshold.
PrevShift
Determines how many bars back are used as a reference point to calculate the angle. A larger value smooths the signal but introduces more lag.
CurShift
Controls the current bar offset used in the calculation. Usually set to 0 to use the latest bar, but can be shifted to analyze past data points.