Overview of the True Breakout Levels Indicator
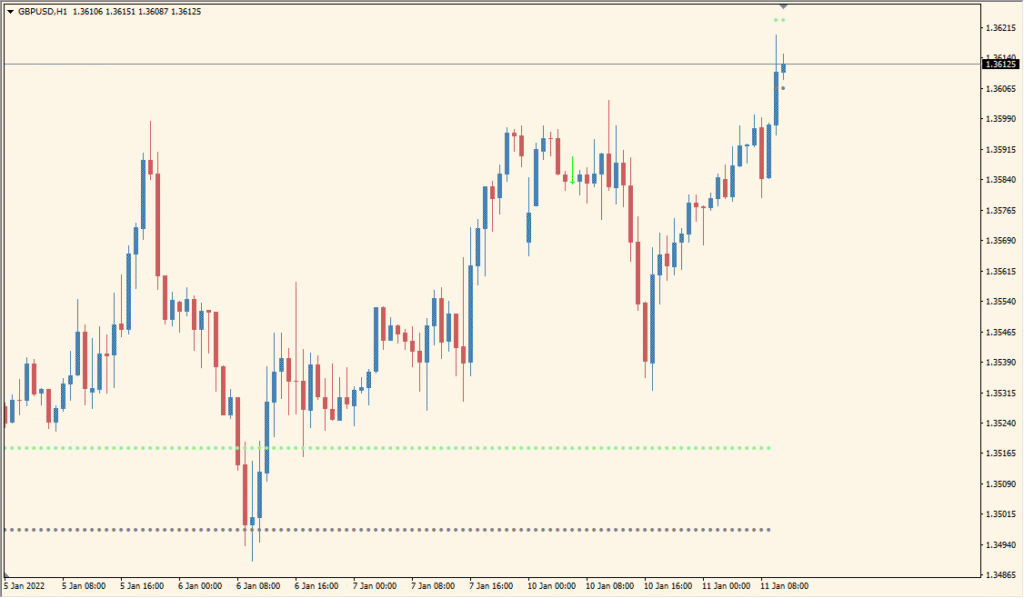
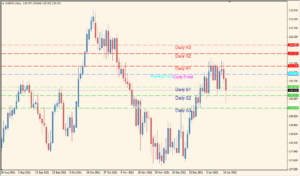
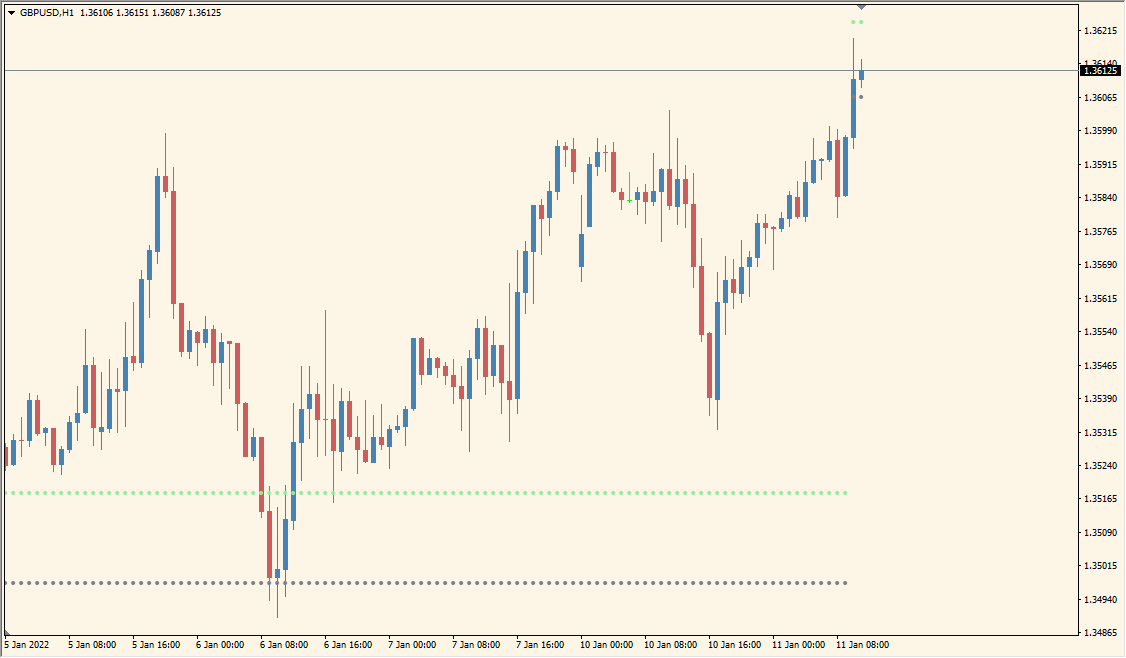
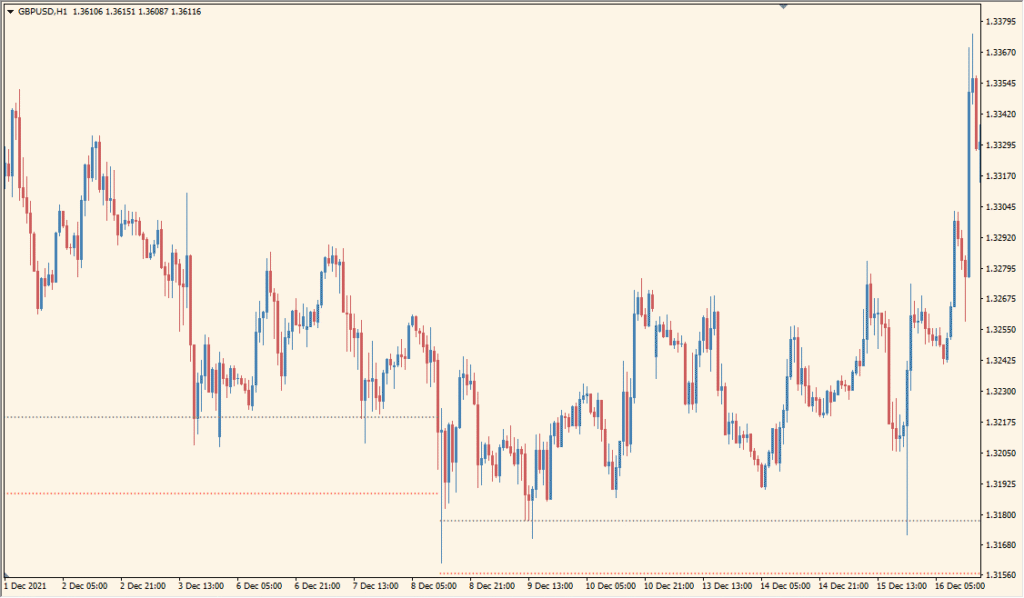
The True Breakout Levels indicator for MT4 helps traders identify critical support and resistance levels where price is more likely to break out with momentum. It filters out noise by analyzing past price behavior to plot meaningful levels where the market has reacted multiple times. This makes it easier to focus on zones that actually matter for breakout trades.
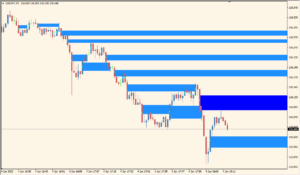
Unlike basic horizontal lines based on highs/lows, this tool studies a set number of historical candles to detect price clusters and builds levels accordingly. This makes it useful for breakout strategies and determining reaction zones in both trending and ranging markets.
How to Use It in Practice
In live trading, you can use the True Breakout Levels indicator to:
- Spot high-probability breakout areas to plan entries and exits.
- Avoid trading inside the range by waiting for price to approach key levels.
- Use breakout levels as stop-loss or take-profit targets.
- Filter false breakouts by confirming candle closes beyond the plotted zones.
This indicator works well across all timeframes and pairs. It’s especially useful in sideways markets where price tends to consolidate before making sharp moves.
Parameter Explanations
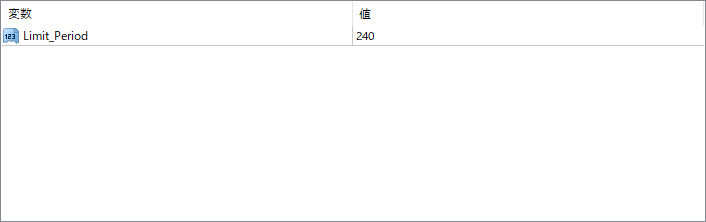
Limit_Period
Controls how many past candles are analyzed to generate breakout levels. A higher value means the indicator looks further back in history, which may produce stronger but fewer levels. A smaller value focuses on more recent price action and can produce more responsive levels.