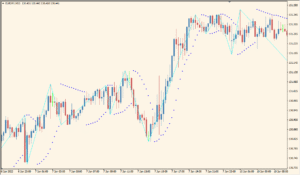
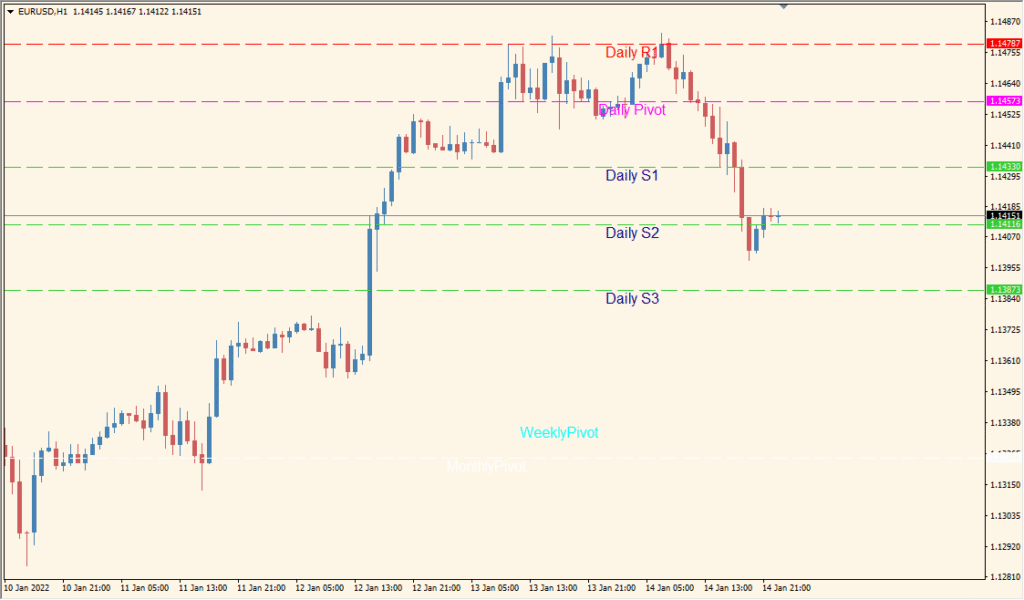
Overview of the auto-pivot Indicator
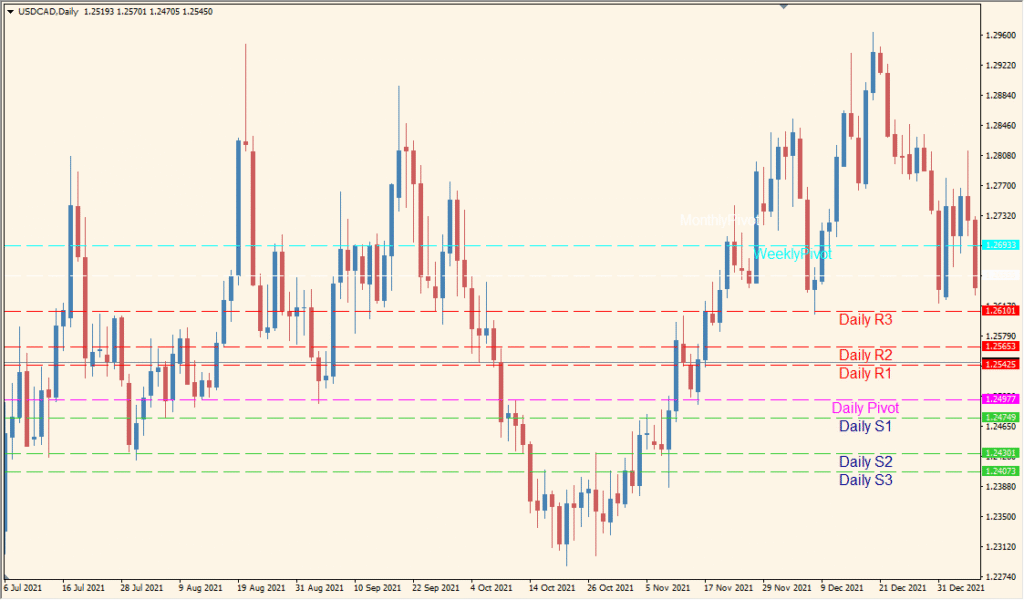
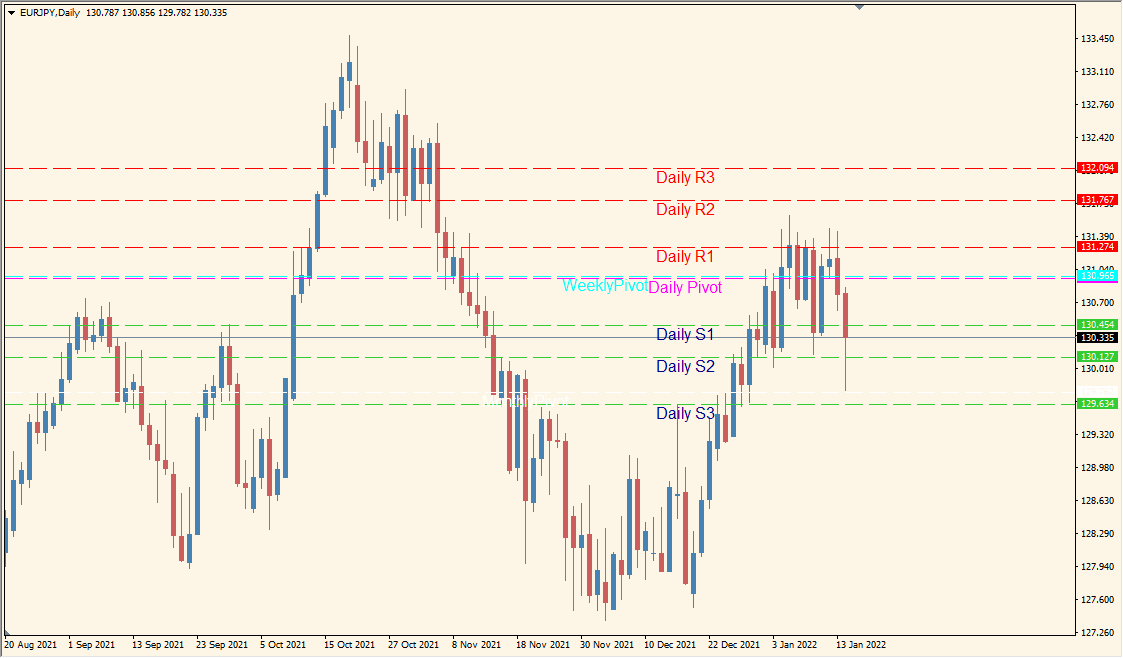
The auto-pivot indicator for MT4 automatically draws daily, weekly, and monthly pivot levels on the chart. It includes central pivot points as well as support and resistance lines (R1, S1, etc.), helping traders quickly identify key price levels where the market might react.
This tool is ideal for day traders and swing traders who rely on pivot-based strategies. It updates the levels in real time, giving a consistent frame of reference for entries, exits, and stop-loss placements.
How to Use It in Practice
In live trading, you can use the auto-pivot indicator to:
- Identify bounce or breakout areas based on daily or weekly pivot levels.
- Plan trades around S1, S2, R1, R2 levels with tight risk control.
- Filter trade direction by comparing current price to pivot levels (above = bullish bias, below = bearish).
- Set take profit targets at the next pivot level.
This indicator works well on any timeframe and can be combined with candlestick patterns, volume, or trend indicators for added confirmation.
Parameter Explanations
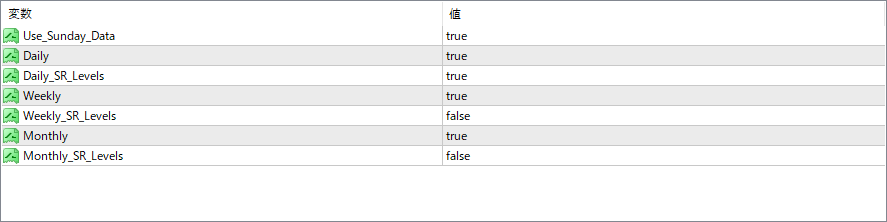
Use_Sunday_Data
Includes or excludes Sunday candles when calculating pivot levels. Useful for brokers with Sunday data that could distort levels.
Daily
Enables or disables display of daily pivot levels on the chart.
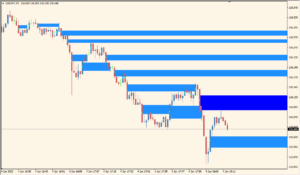
Daily_SR_Levels
If enabled, shows daily support and resistance levels (S1, R1, etc.) along with the daily pivot point.
Weekly
Enables or disables display of weekly pivot levels on the chart.
Weekly_SR_Levels
If enabled, shows weekly support and resistance levels (S1, R1, etc.) along with the weekly pivot point.
Monthly
Enables or disables display of monthly pivot levels on the chart.
Monthly_SR_Levels
If enabled, shows monthly support and resistance levels (S1, R1, etc.) along with the monthly pivot point.