Overview of the Keltner_Cloud Indicator

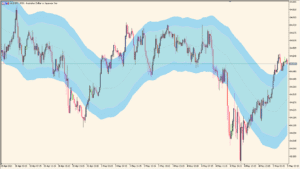
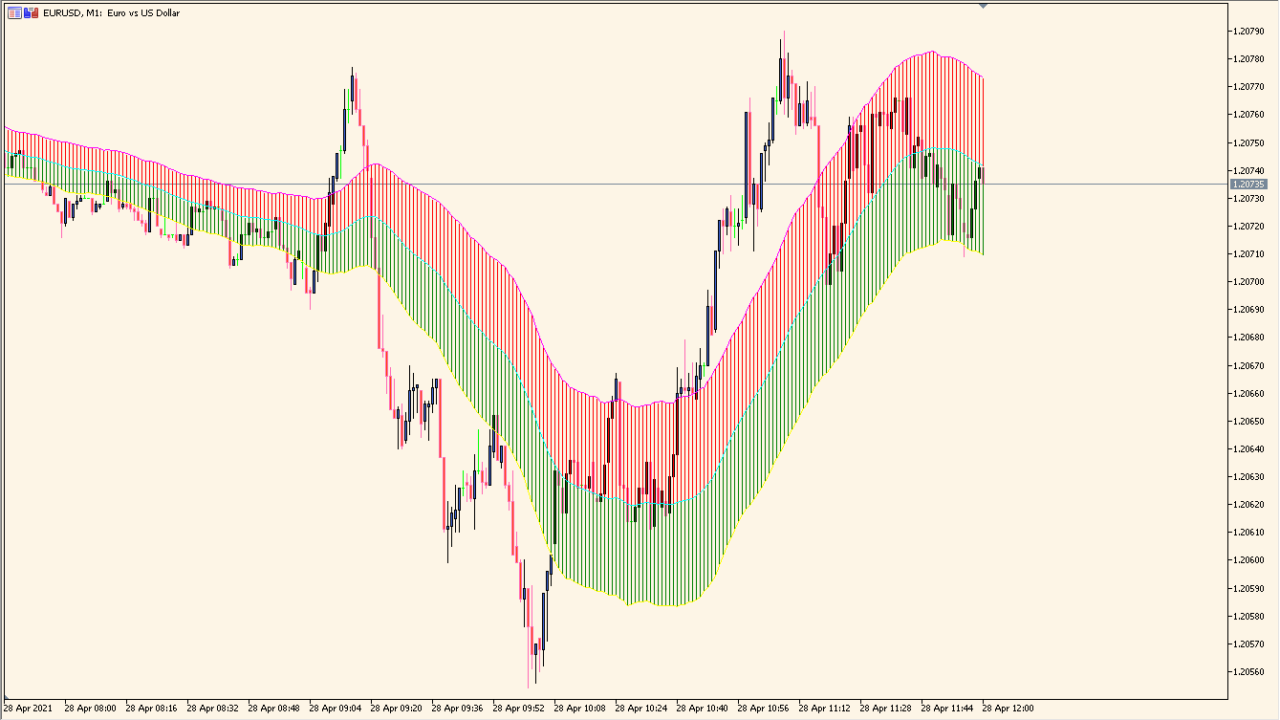
The Keltner_Cloud indicator for MT4 creates a dynamic price envelope based on Keltner Channel logic. It uses a central line smoothed over a defined number of periods, and upper/lower bands are plotted based on volatility-adjusted deviation. The result is a “cloud” that visually highlights trending conditions and potential support/resistance zones.
This tool helps traders follow the trend and assess overbought or oversold areas by comparing price action to the channel. It works similarly to Bollinger Bands but is based on smoothed average ranges rather than standard deviation.
How to Use It in Practice
In live trading, the Keltner_Cloud indicator can be used to:
- Identify the overall trend direction — price above the cloud suggests an uptrend, below suggests a downtrend.
- Spot pullbacks — entries can be planned when price touches or re-enters the cloud in a trending market.
- Use the cloud boundaries as dynamic support and resistance levels.
- Filter entries and exits with other signals (e.g., price action or oscillators).
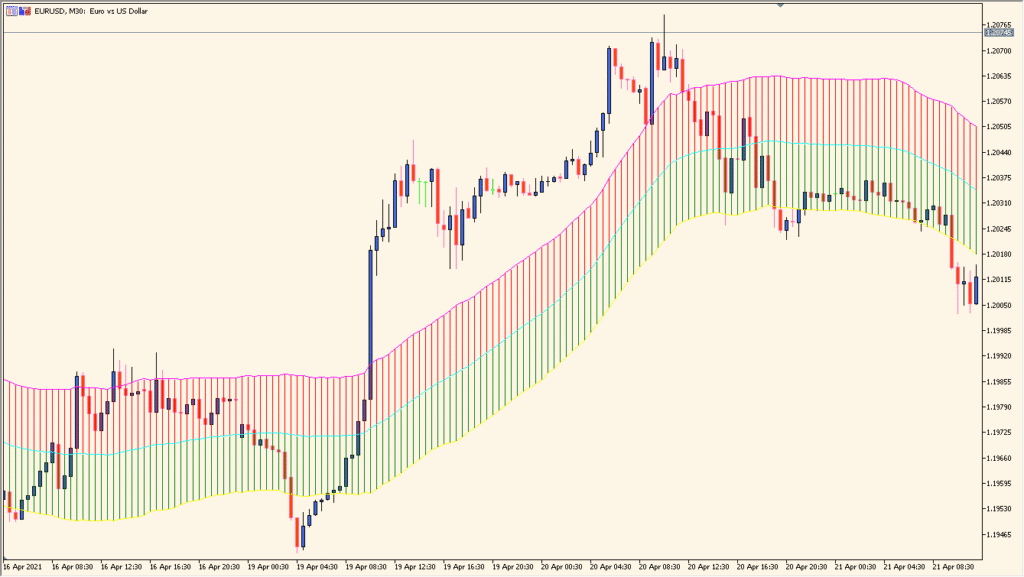
It is best used on higher timeframes (H1 and above) to reduce noise and false signals. This tool fits well into trend-following or breakout strategies.
Parameter Explanations
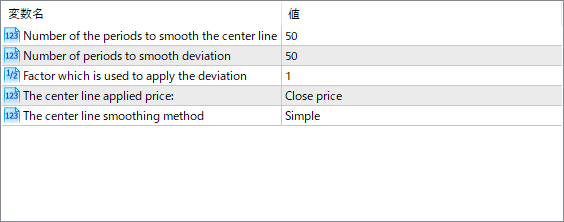
Number of the periods to smooth the center line
Defines how many bars are used to smooth the center line. More periods create a slower, more stable line.
Number of periods to smooth deviation
Sets how many periods are used to calculate the volatility/deviation from the center line. Affects the width of the cloud.
Factor which is used to apply the deviation
This is the multiplier for the deviation. Higher values will create a wider cloud, capturing more price action.
The center line applied price
Specifies which price to use for the calculation (e.g., Close, Open, High/Low average).
The center line smoothing method
Determines how the center line is smoothed. Common options are Simple, Exponential, etc.