Overview of the double_stochastic_rsi Indicator
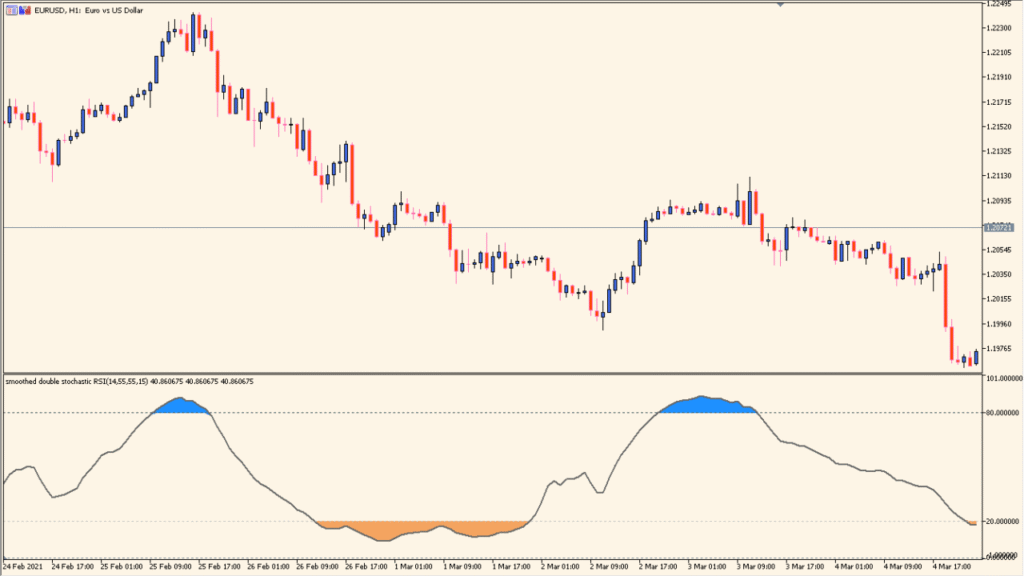
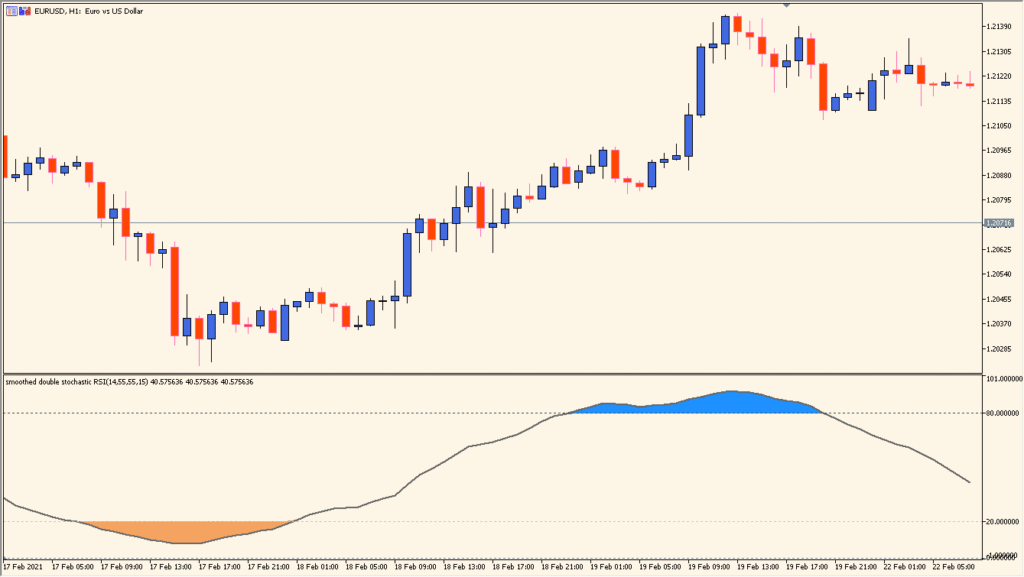
The double_stochastic_rsi indicator blends the Relative Strength Index (RSI) with two layers of stochastic calculations. This results in a highly sensitive oscillator that captures overbought and oversold conditions with more nuance than using RSI or Stochastic alone. The output is a smooth line that reacts to momentum shifts while reducing noise from price fluctuations.
It’s mainly used to identify potential reversal points in ranging or weakly trending markets. Traders often use it to refine entry and exit timing based on momentum exhaustion.
How to Use It in Practice
In live trading, you can use the double_stochastic_rsi to:
- Spot divergence between price and the oscillator for early trend shift signals.
- Use the 80 and 20 level markers to anticipate potential reversals or pullbacks.
- Combine with trend-following tools to time entries during pullbacks.
- Avoid entries when the oscillator is mid-range and not showing clear extremes.
This tool works best in sideways markets or when used as a timing filter in trend strategies.
Parameter Explanations
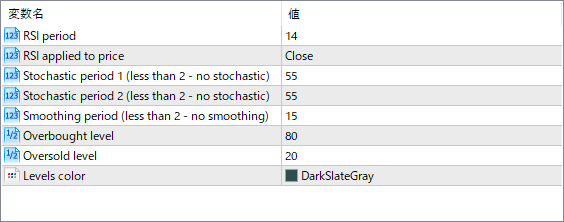
RSI period
Sets the number of candles used to calculate the RSI base line before the stochastic is applied.
RSI applied to price
Determines which price type (e.g., Close, Open) the RSI is calculated on.
Stochastic period 1
Defines the lookback period for the first stochastic smoothing. If less than 2, this layer is skipped.
Stochastic period 2
Defines the lookback period for the second stochastic smoothing. If less than 2, this layer is skipped.
Smoothing period
Controls how smooth the final output line is by applying additional moving average smoothing.
Overbought level
Sets the upper threshold, often used to identify when the market is potentially overbought.
Oversold level
Sets the lower threshold, signaling a potentially oversold market.
Levels color
Changes the color of the overbought and oversold guide levels for visual clarity.