Overview of the VarMovAvg Indicator
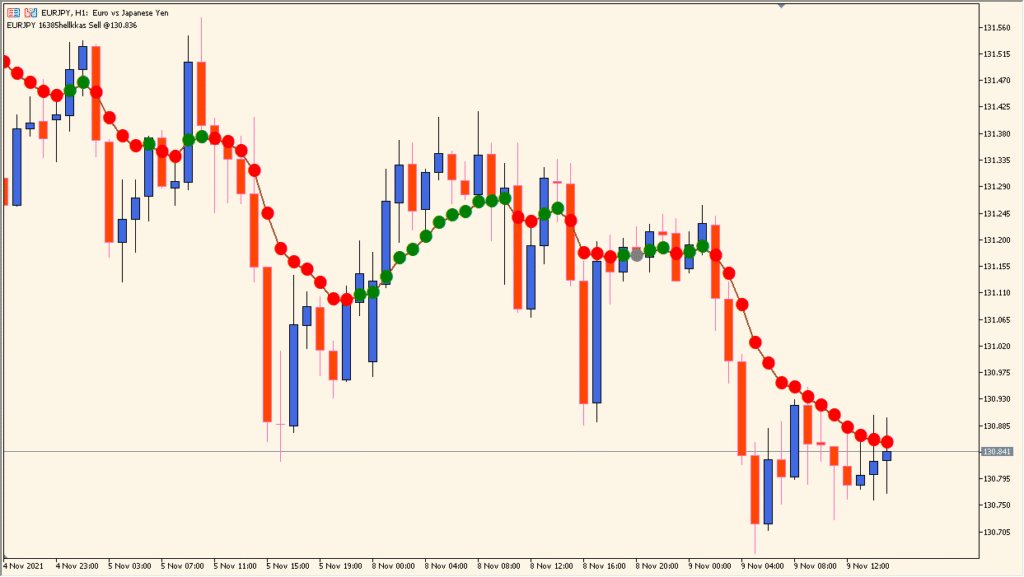
The VarMovAvg indicator for MT4 is a variation of the Adaptive Moving Average that adjusts its sensitivity based on market volatility. It aims to reduce lag during trend changes while maintaining smoothness in stable periods. The indicator plots color-coded dots directly on the chart — typically green for bullish momentum and red for bearish — making it easy to read at a glance.
This adaptive approach helps traders capture dynamic market movements more efficiently compared to standard moving averages, minimizing false signals in ranging markets.
How to Use It in Practice
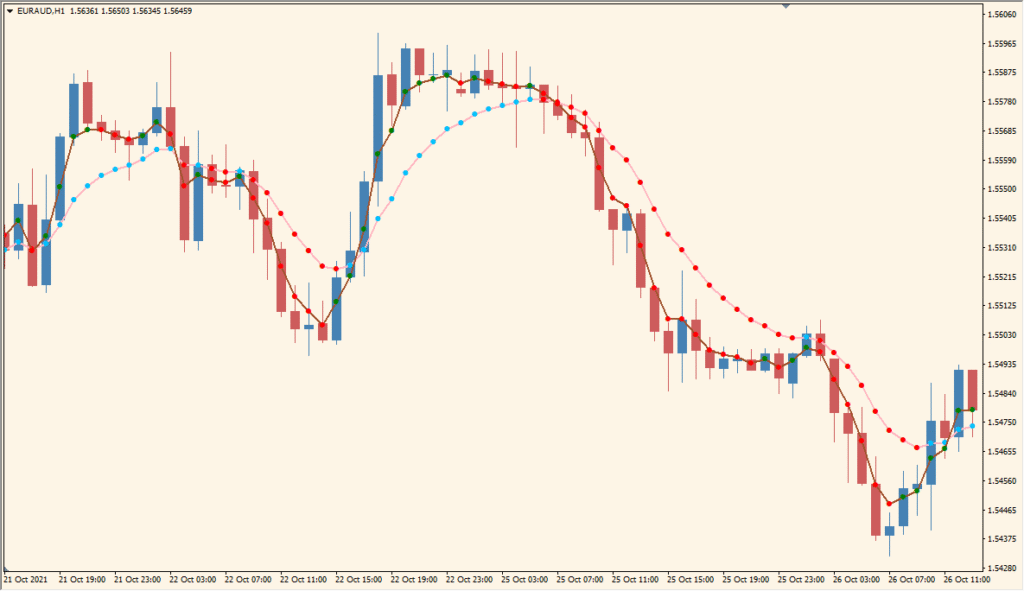
In real trading, VarMovAvg can be used to identify short-term and medium-term trends with greater accuracy. When the dots turn green, it suggests a bullish phase; when they turn red, it signals a bearish phase.
- Use color changes as confirmation for trend entries or exits.
- Combine with other filters like RSI or MACD to avoid whipsaws in low-volatility periods.
- Enable the sound alert to be notified when a trend shift occurs.
The indicator works well for swing traders and intraday traders who prefer visual cues for trend changes without relying on additional panels or dashboards.
Parameter Explanations
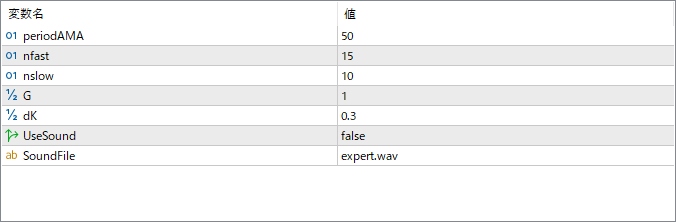
periodAMA
Sets the main adaptive moving average period. Larger values make the indicator smoother and less sensitive to small fluctuations.
nfast
Defines the fast smoothing factor, determining how quickly the moving average reacts during volatile price changes.
nslow
Specifies the slow smoothing factor used when the market is less volatile, providing a steadier average line.
G
A multiplier that controls the adaptive sensitivity. Higher values increase the responsiveness of the indicator to market changes.
dK
Defines the smoothing constant used in internal calculations, fine-tuning how smoothly the adaptive response transitions between fast and slow phases.
UseSound
Enables or disables the sound alert when a color change (trend reversal) occurs on the chart.
SoundFile
Specifies the audio file to play when the alert is triggered, allowing for a customized notification sound.