Overview of the All Time Frame Stochastic Indicator
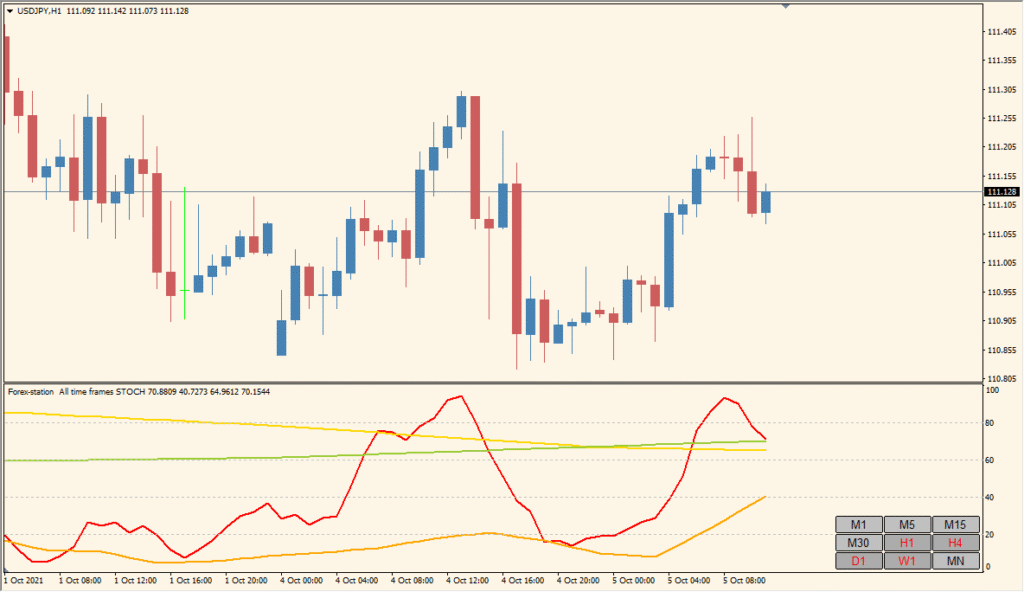
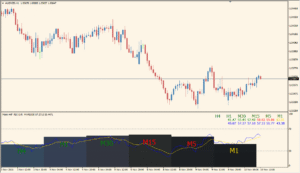
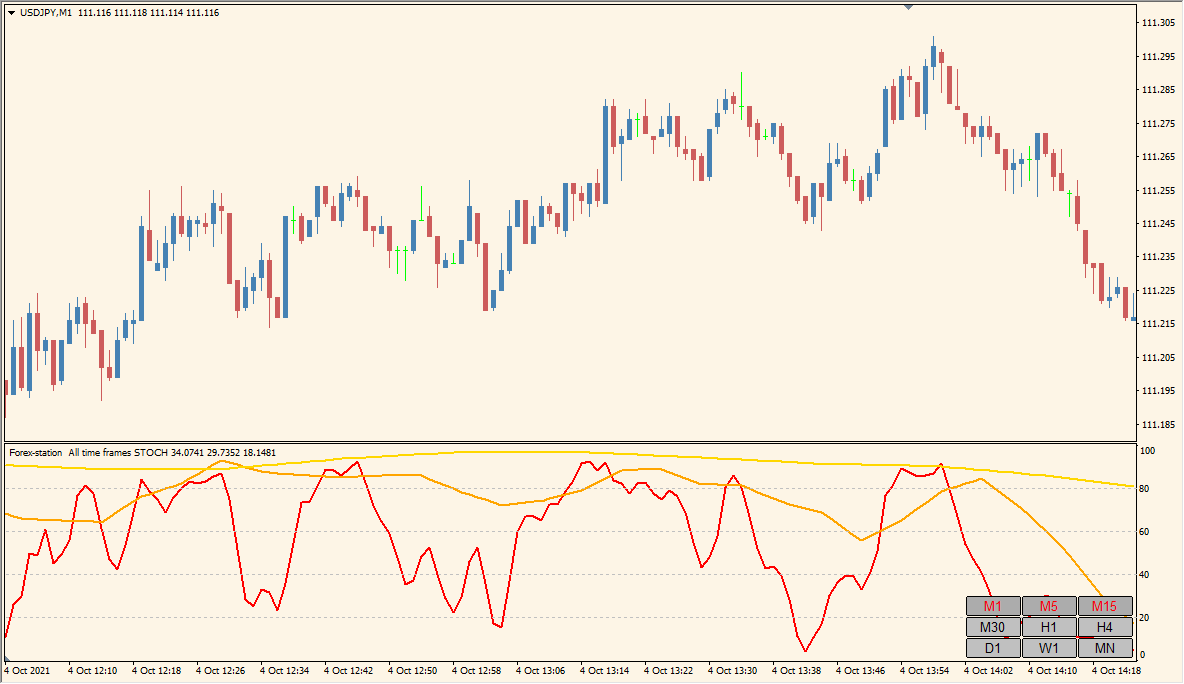
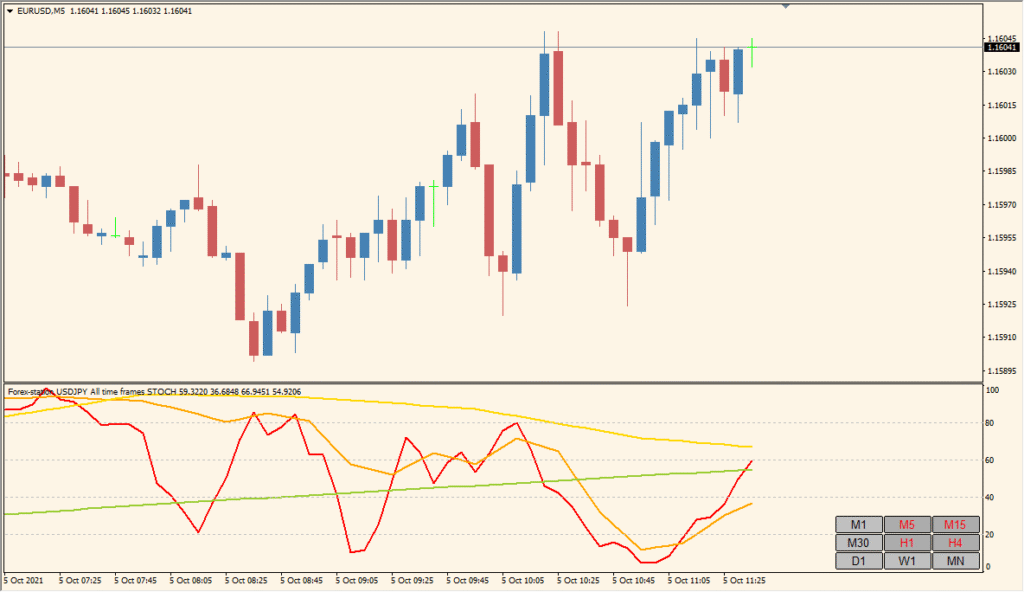
The All Time Frame Stochastic indicator shows the status of the Stochastic oscillator across multiple timeframes in one panel. Instead of switching charts repeatedly, traders can check overbought/oversold conditions or trend alignment for all timeframes in one place. It’s a practical tool for multi-timeframe confirmation.
Each button corresponds to a timeframe and is colored depending on the Stochastic condition. Clicking a button can switch the chart to that timeframe, streamlining analysis.
How to Use It in Practice
In trading, you can use this indicator to:
- Quickly assess if Stochastic is aligned across timeframes for trend confirmation.
- Identify divergences in Stochastic signals between short-term and long-term charts.
- Spot overbought/oversold zones without switching charts manually.
- Set alerts when conditions meet specific levels (e.g., below 50 for bearish signals).
It’s particularly useful for traders who rely on momentum or reversal strategies using the Stochastic oscillator and want a more efficient multi-timeframe view.
Parameter Explanations
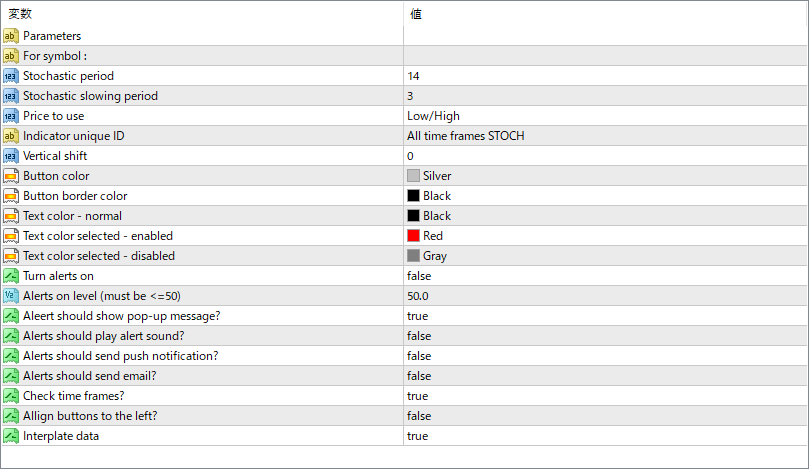
For symbol :
Defines which symbol the indicator should track. Usually left blank to default to the current chart.
Stochastic period
Number of bars used to calculate the Stochastic %K value.
Stochastic slowing period
Smoothing factor applied to the %K line to reduce noise.
Price to use
Sets the type of price applied to the calculation, typically Low/High.
Indicator unique ID
Used to differentiate this instance if running multiple copies on the same chart.
Vertical shift
Moves the panel up or down vertically on the chart.
Button color
Color of the buttons when not selected.
Button border color
Color of the button border.
Text color – normal
Color of the text on inactive buttons.
Text color selected – enabled
Text color when a button is selected and active.
Text color selected – disabled
Text color when a button is selected but not active.
Turn alerts on
Enables or disables all alert features.
Alerts on level (must be <=50)
Set the threshold level for triggering alerts. Commonly used with 50 for neutral line crossing.
Alert should show pop-up message?
Displays a message window when alert conditions are met.
Alerts should play alert sound?
Plays a sound when an alert triggers.
Alerts should send push notification?
Sends a push notification to your device via MetaTrader app.
Alerts should send email?
Sends alert information to your registered email address.
Check time frames?
Ensures buttons represent the correct current values from each timeframe.
Allign buttons to the left?
Aligns the panel buttons to the left side of the chart instead of right.
Interplate data
Interpolates data to make the Stochastic smoother between candles.