Overview of the ATR Probability Levels Indicator
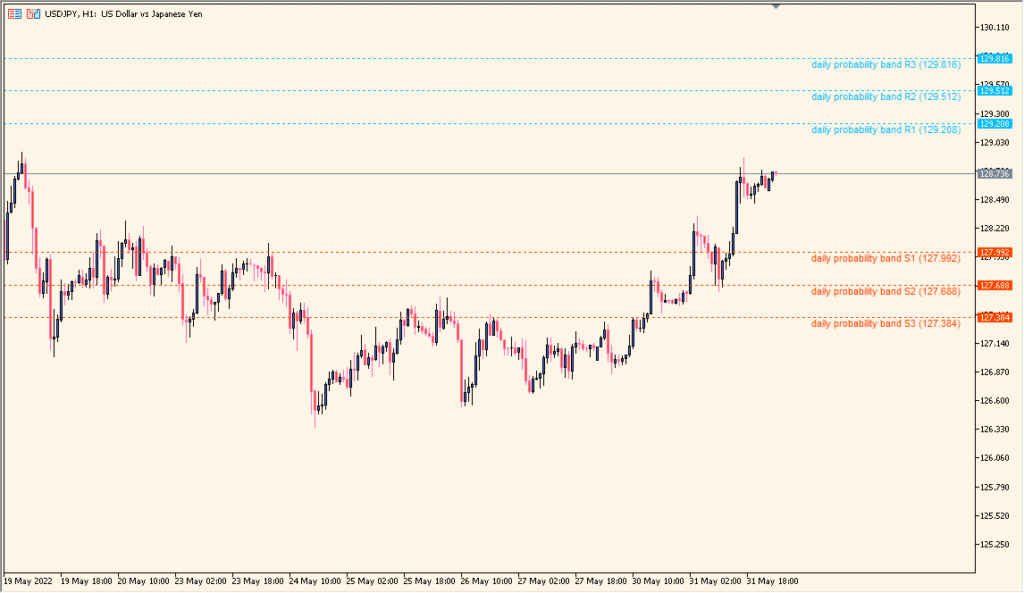
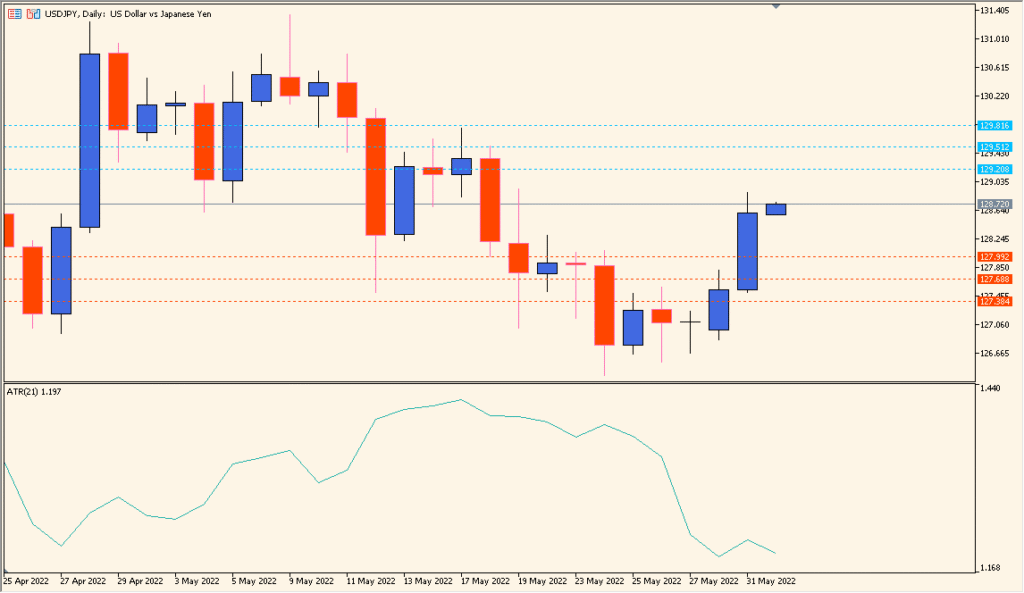
The ATR Probability Levels indicator for MT4 draws daily volatility bands on the chart using the Average True Range (ATR). These bands represent potential high and low price zones based on recent volatility. It helps traders estimate daily price ranges and identify overextended moves relative to average market behavior.
By using the daily ATR value, the indicator projects upper and lower probability levels that can serve as dynamic support and resistance areas. These levels update automatically as market volatility changes.
How to Use It in Practice
In practical trading, the ATR Probability Levels indicator can be used to:
- Estimate the expected daily range for price movement based on volatility.
- Identify potential reversal or breakout points when the price approaches the ATR bands.
- Adjust stop-loss and take-profit targets according to current market volatility.
- Confirm overbought or oversold conditions alongside other indicators.
This tool is useful for both day traders and swing traders who rely on volatility-based price projections rather than static levels.
Parameter Explanations
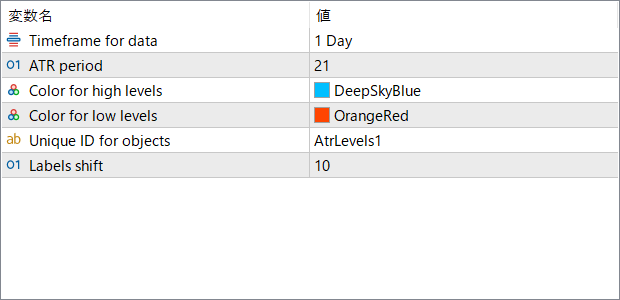
Timeframe for data
Specifies the timeframe used to calculate the ATR-based probability levels. For example, “1 Day” uses the daily ATR to project the day’s potential price range.
ATR period
Determines the number of periods used to calculate the Average True Range. A higher value smooths the levels and reduces sensitivity to short-term volatility.
Color for high levels
Sets the color of the upper ATR bands displayed on the chart.
Color for low levels
Sets the color of the lower ATR bands displayed on the chart.
Unique ID for objects
Defines a unique label identifier for the chart objects. Useful when using multiple instances of the indicator.
Labels shift
Moves the label position horizontally to avoid overlapping with price candles.