Overview of the Indicator
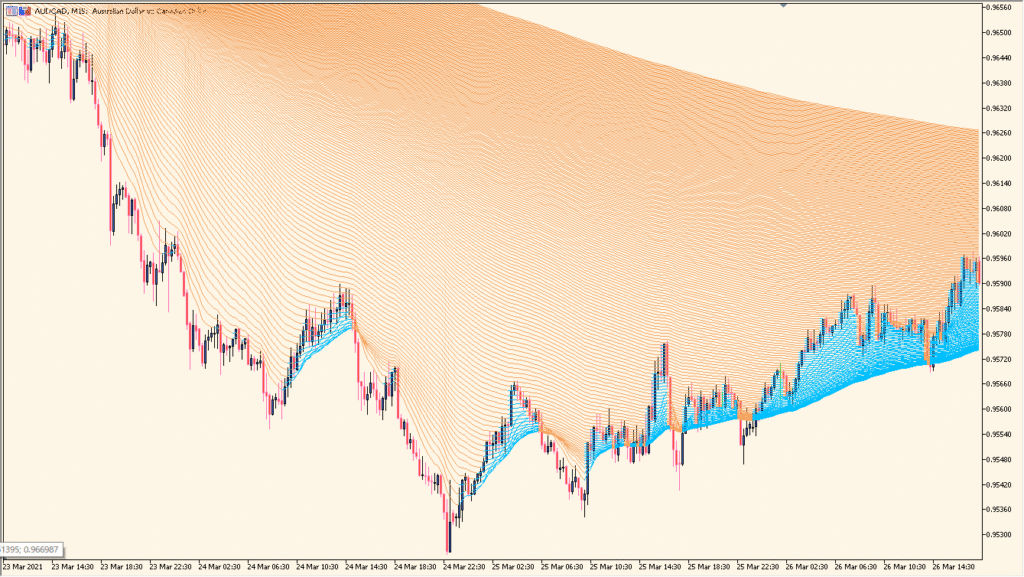
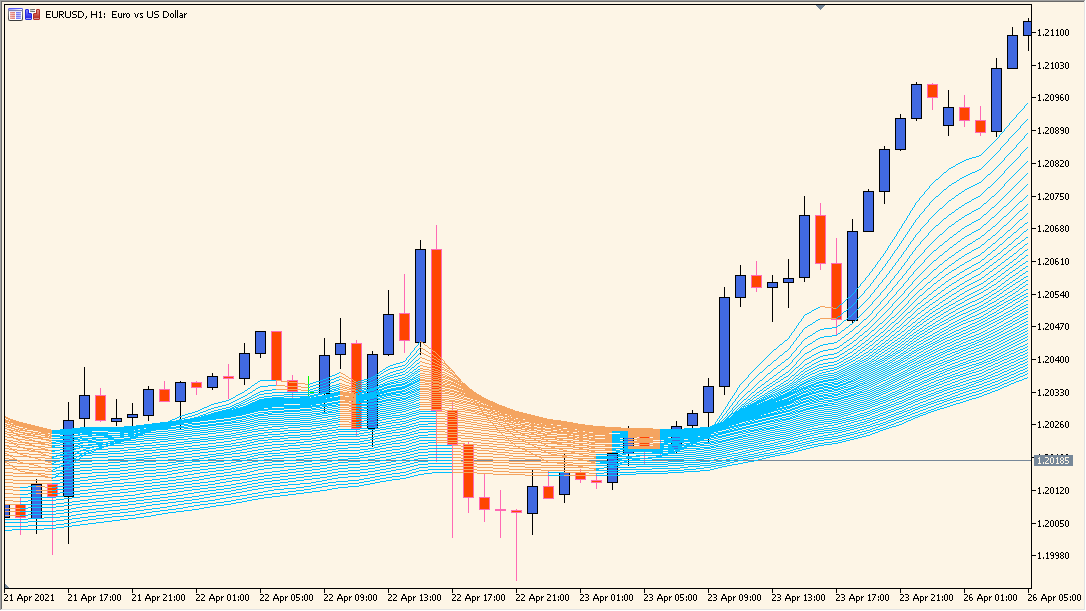
The averages-rainbow indicator displays multiple moving averages arranged in a layered ribbon format. Each line represents a moving average with a progressively increasing period, creating a “rainbow” structure on the chart.
When the lines are clearly separated and aligned in one direction, the market is trending strongly. When they compress and overlap, the market is consolidating. The visual spacing between the averages makes it easy to judge both direction and momentum at a glance.
How to Use It in Practice

In an uptrend, shorter-period averages stay above longer-period averages, and the ribbon expands upward. In a downtrend, the structure flips and the ribbon expands downward.
Traders can use the ribbon expansion as confirmation of trend strength and look for pullbacks toward the inner averages as potential continuation entries. When the ribbon flattens and narrows, it often signals reduced momentum or a possible transition into a range.
Parameters
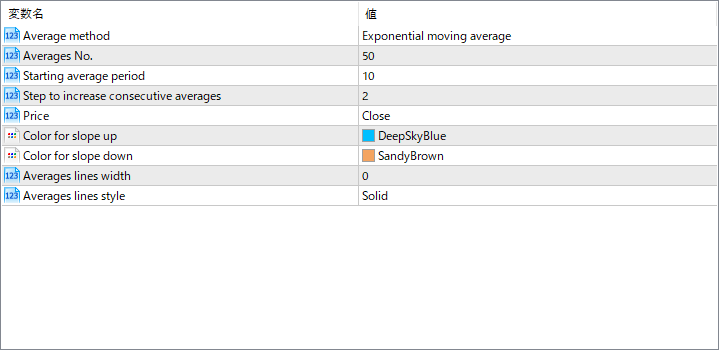
Average method
Defines the type of moving average used for all lines, such as Exponential, Simple, Smoothed, or Linear Weighted. This affects how quickly the ribbon reacts to price changes.
Averages No.
Specifies how many moving average lines are plotted. A larger number creates a denser ribbon and provides more detail about trend structure.
Starting average period
Sets the period of the first (fastest) moving average in the sequence.
Step to increase consecutive averages
Determines how much each subsequent moving average period increases from the previous one. This controls the spacing between lines.
Price
Selects which price type is used for the calculations, such as Close, Open, High, or Low.
Color for slope up
Defines the color of the averages when their slope is upward.
Color for slope down
Defines the color of the averages when their slope is downward.
Averages lines width
Controls the thickness of each moving average line.
Averages lines style
Sets the line style, such as solid or dashed.