Overview of the Background Candle HTF Indicator
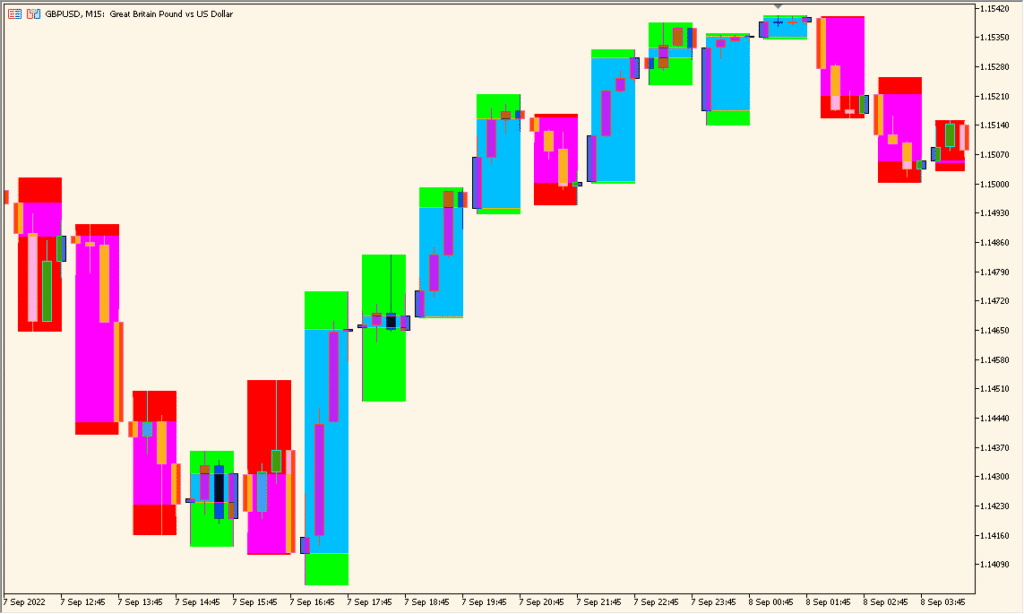
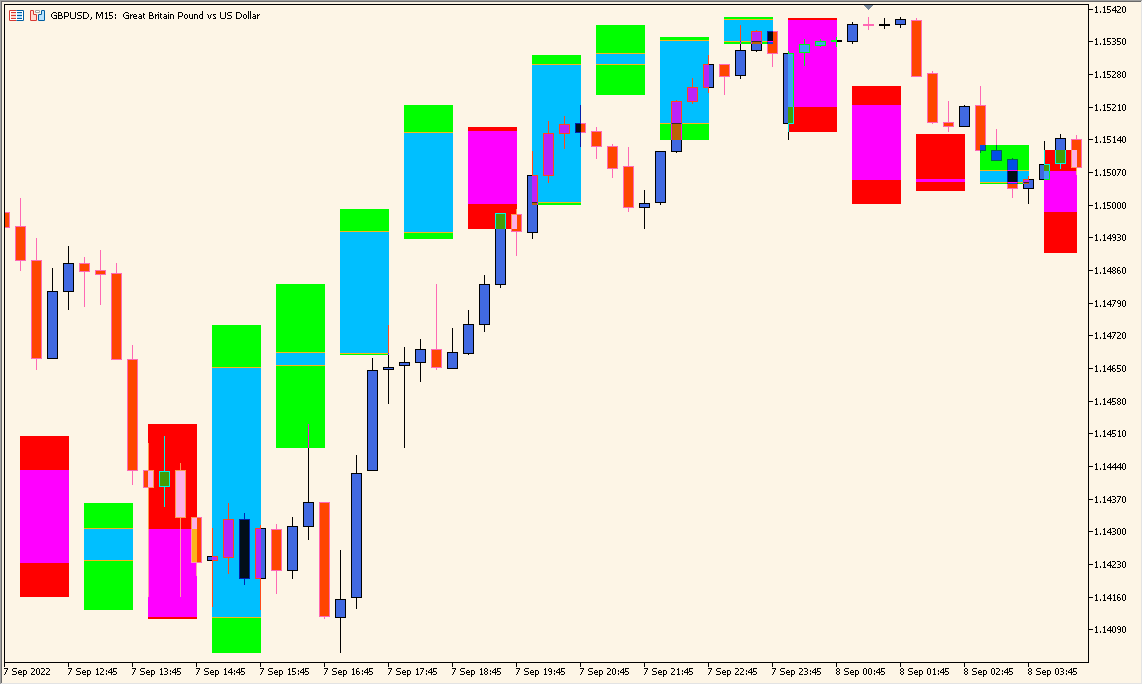
The Background Candle HTF indicator displays higher timeframe candles directly on a lower timeframe chart. These candles appear in the background with distinctive colors, allowing traders to easily see how current price movements fit within the broader market structure of higher timeframes.
This helps traders maintain a multi-timeframe perspective without switching charts, providing better context for entries, exits, and trend continuation setups.
How to Use It in Practice
In practical trading, the Background Candle HTF indicator can be used to:
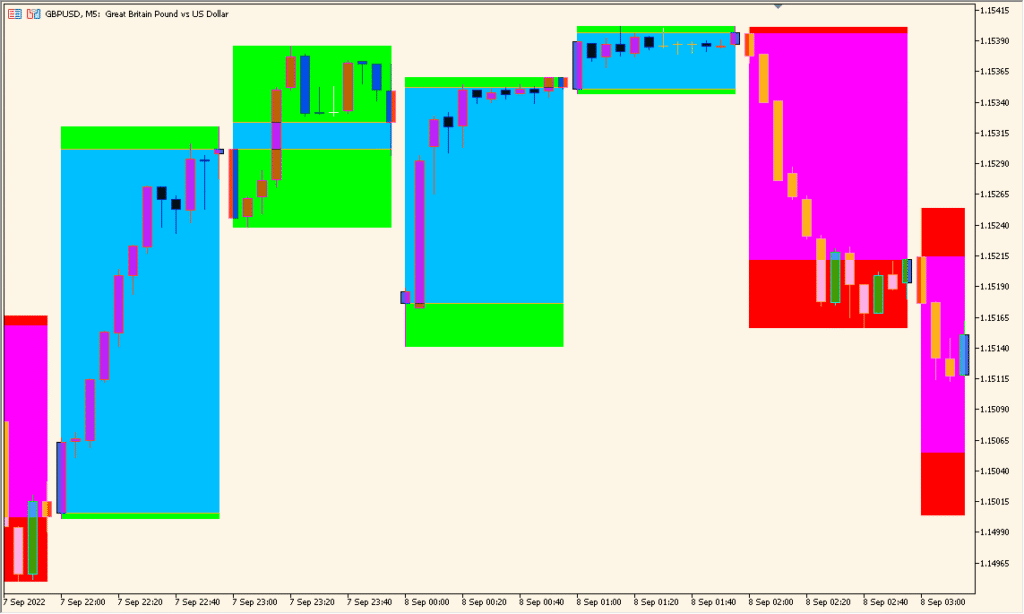
- Overlay higher timeframe candles (such as H1 or H4) on a lower chart like M5 or M15.
- Identify key swing highs and lows from the higher timeframe while focusing on lower-timeframe entries.
- Spot higher timeframe bullish or bearish candles to confirm trade direction.
- Visually track when the lower timeframe price action is approaching the high or low of a higher timeframe candle.
This tool is especially useful for traders who use top-down analysis and want to keep higher timeframe context visible at all times.
Parameter Explanations
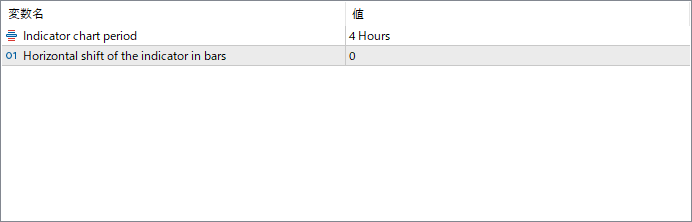
Indicator chart period
Specifies the higher timeframe used for background candles (e.g., 1 Hour, 4 Hours, or 1 Day). The indicator will draw those candles behind the lower timeframe chart.
Horizontal shift of the indicator in bars
Moves the higher timeframe candles horizontally by a set number of bars. This is useful for visual adjustments or aligning the candles with your chart layout.