Overview of the BB MACD Indicator

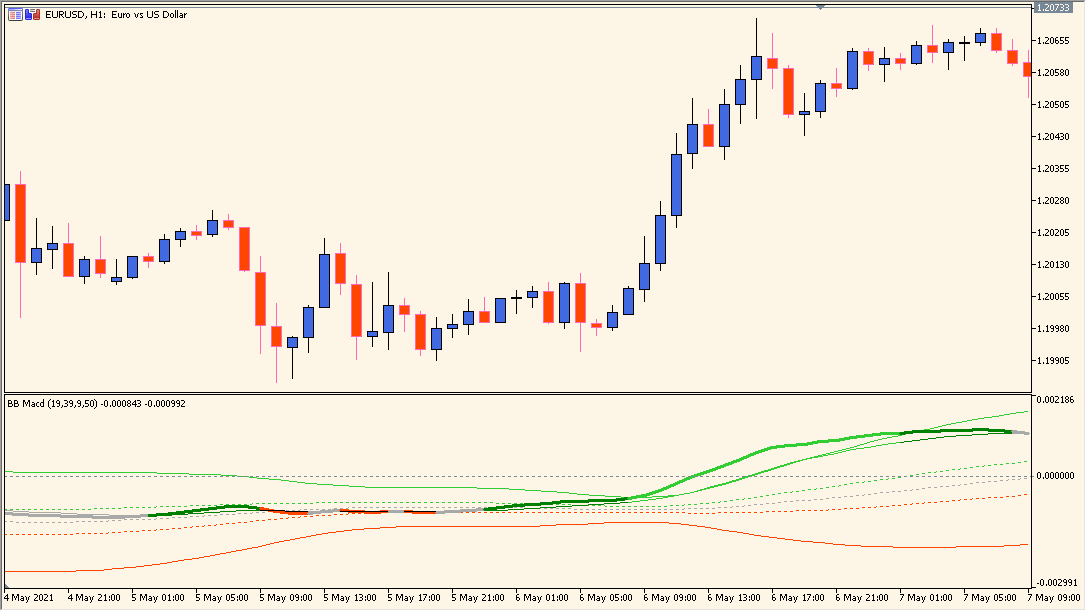
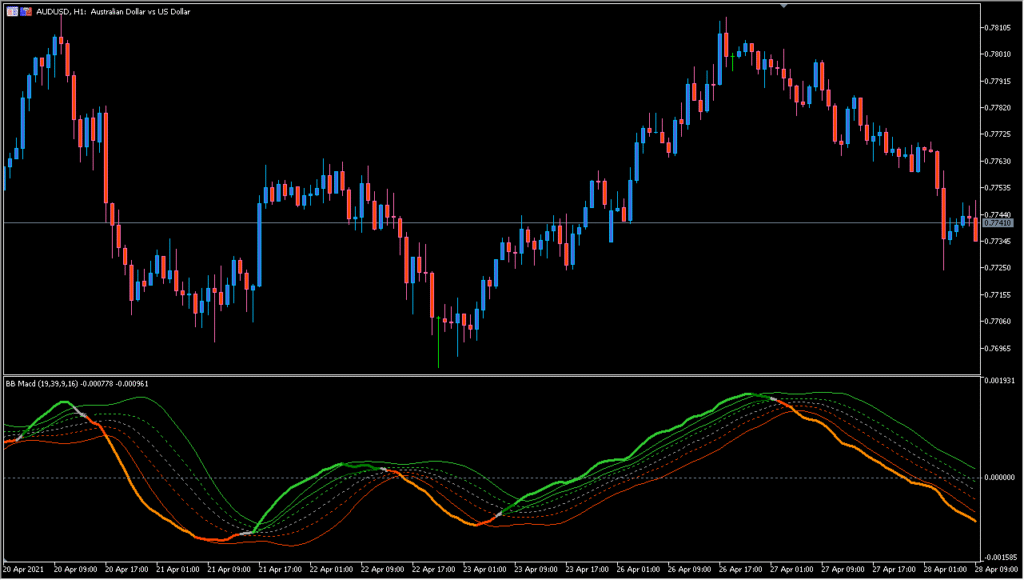
The BB MACD indicator for MT4 combines the Moving Average Convergence Divergence (MACD) with Bollinger Bands to provide a clearer picture of market momentum and volatility. This hybrid tool helps traders identify momentum shifts while also gauging whether price movements are within normal volatility ranges or approaching extremes.
By plotting the MACD with Bollinger Bands around it, the indicator gives traders visual cues on when momentum is strong and when it might be overextended, potentially signaling reversals or pullbacks.
How to Use It in Practice
In live trading, the BB MACD can be used to:
- Identify bullish and bearish momentum trends with MACD crossovers.
- Spot potential overbought or oversold momentum levels when MACD values approach or exceed the Bollinger Bands.
- Combine momentum and volatility analysis in one chart for faster decision-making.
- Filter trades by confirming momentum direction and volatility conditions before entry.
This makes it suitable for both trend-following strategies and mean-reversion setups.
Parameter Explanations
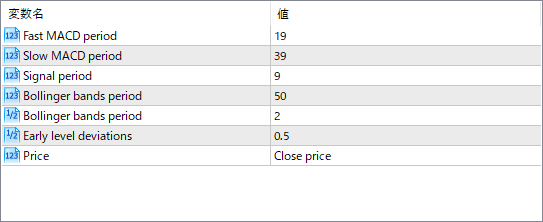
Fast MACD period
Number of periods used for the faster moving average in the MACD calculation.
Slow MACD period
Number of periods used for the slower moving average in the MACD calculation.
Signal period
Number of periods used for smoothing the MACD line into the signal line.
Bollinger bands period
Number of periods used to calculate the Bollinger Bands around the MACD line.
Bollinger bands deviations
Standard deviation multiplier for the Bollinger Bands width.
Early level deviations
Deviation level for an additional inner band, often used to spot early momentum changes.
Price
Type of price used in the calculation (e.g., close price, open price, etc.).