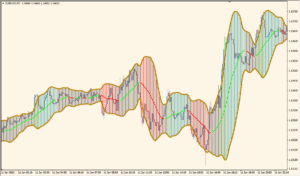
Overview of the BB_MA_toggle Indicator
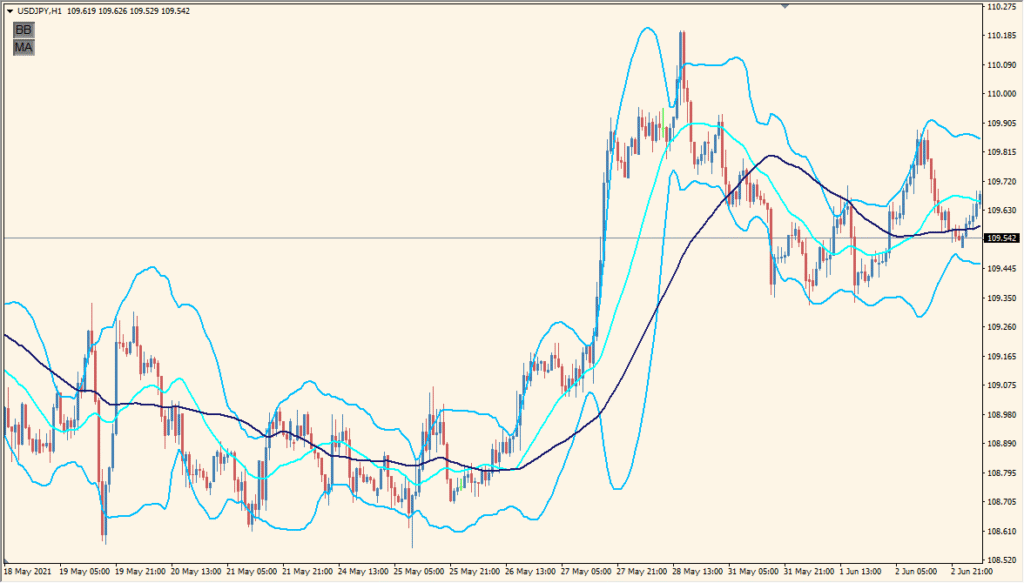
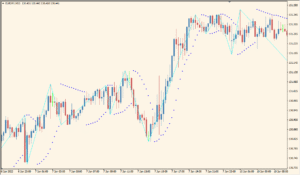
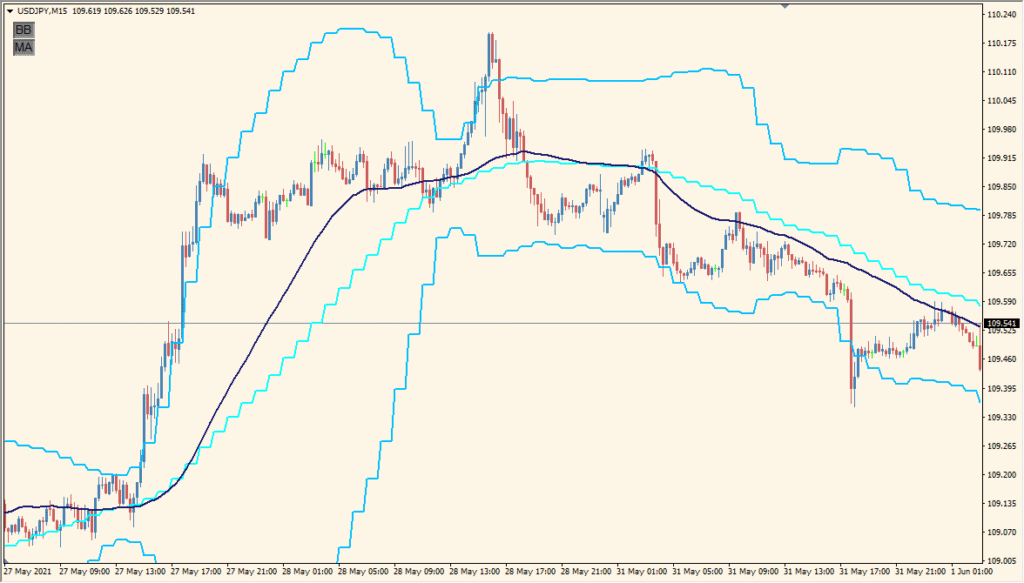
The BB_MA_toggle indicator combines Bollinger Bands and a Moving Average in one tool. It allows traders to display or hide these overlays with simple parameters, making it ideal for visual clarity when analyzing market conditions. The indicator draws Bollinger Bands with user-defined settings and overlays a moving average line for trend direction.
This tool is useful for traders who use both volatility and trend-based strategies and want a clutter-free way to manage chart elements.
How to Use It in Practice
You can use this indicator in live trading to:
- Quickly view or hide Bollinger Bands and Moving Average to suit your charting needs.
- Identify volatility expansions or contractions using Bollinger Bands.
- Determine overall trend direction via the moving average.
- Reduce visual clutter by customizing colors, line styles, and widths.
This flexibility is helpful for traders who analyze price action with minimal distractions or prefer switching views during analysis.
Parameter Explanations
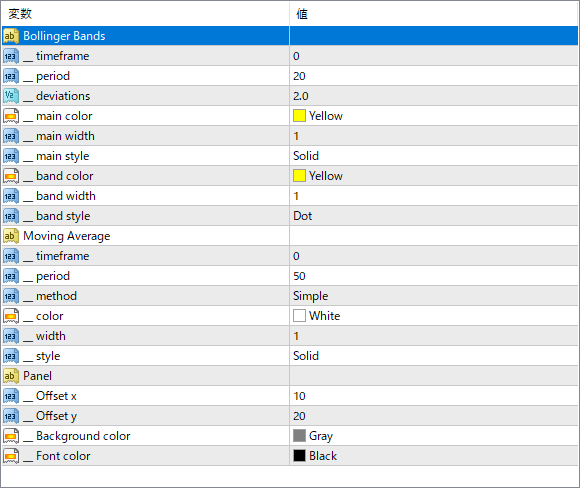
__timeframe
Sets the timeframe for calculating Bollinger Bands or Moving Average. Set to 0 to use the current chart timeframe.
__period
The number of bars used to calculate the Bollinger Bands or Moving Average.
__deviations
Specifies the number of standard deviations for the Bollinger Bands. Affects the width between upper and lower bands.
__main color
The color of the central Bollinger Band line.
__main width
The thickness of the Bollinger Band’s central line.
__main style
Line style of the central Bollinger Band (e.g., Solid, Dashed).
__band color
The color used for the upper and lower Bollinger Bands.
__band width
Line width of the upper and lower bands.
__band style
Line style for the upper and lower Bollinger Bands (e.g., Dot, Dash).
period
The period for the Moving Average line.
method
The type of Moving Average (e.g., Simple, Exponential).
color
Color of the Moving Average line.
width
Thickness of the Moving Average line.
_style
Line style for the Moving Average (e.g., Solid).
Offset x
Horizontal position of the control panel on the chart.
Offset y
Vertical position of the control panel on the chart.
Background color
Background color of the control panel.
Font color
Text color used in the control panel.