Overview of the BBandWidthRatio Indicator
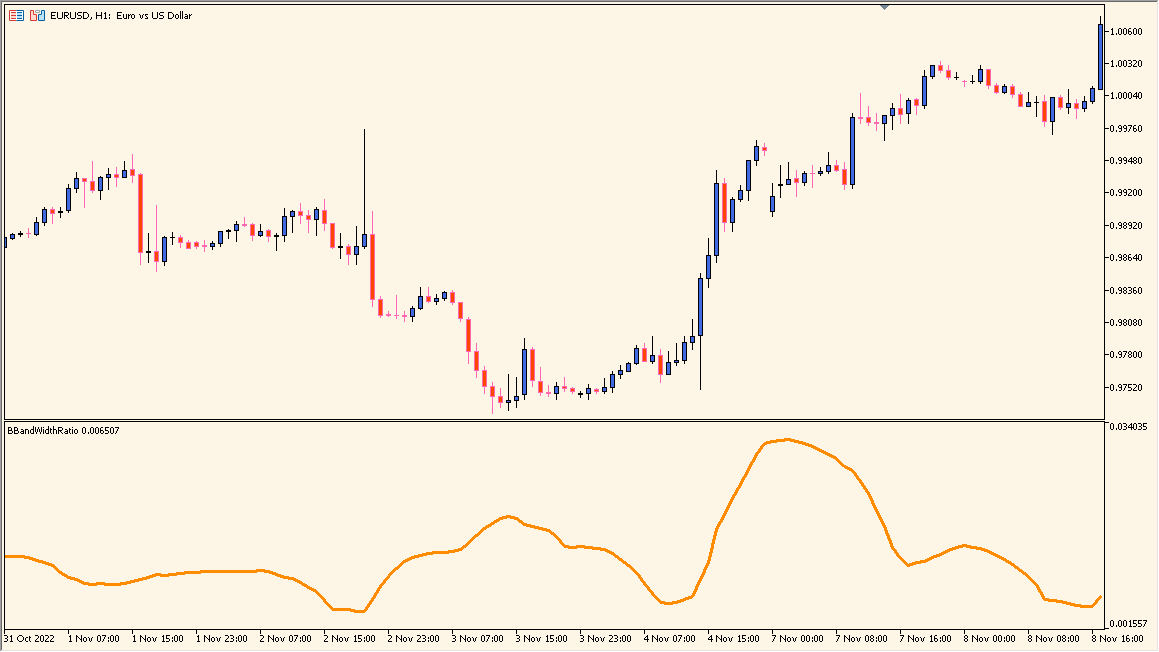
The BBandWidthRatio indicator for MT4 is designed to measure market volatility based on the width of the Bollinger Bands. It calculates the ratio between the upper and lower bands, helping traders identify periods of expansion (high volatility) and contraction (low volatility). This makes it useful for anticipating breakouts or confirming trend strength.
When the ratio is low, the bands are tight, suggesting that the market is consolidating. When the ratio increases, it indicates rising volatility, often preceding strong directional moves. The indicator is plotted as a line below the main chart, making it easy to visualize volatility changes over time.
How to Use It in Practice
In live trading, the BBandWidthRatio indicator can be used to:
- Identify low-volatility zones where price is likely to break out soon.
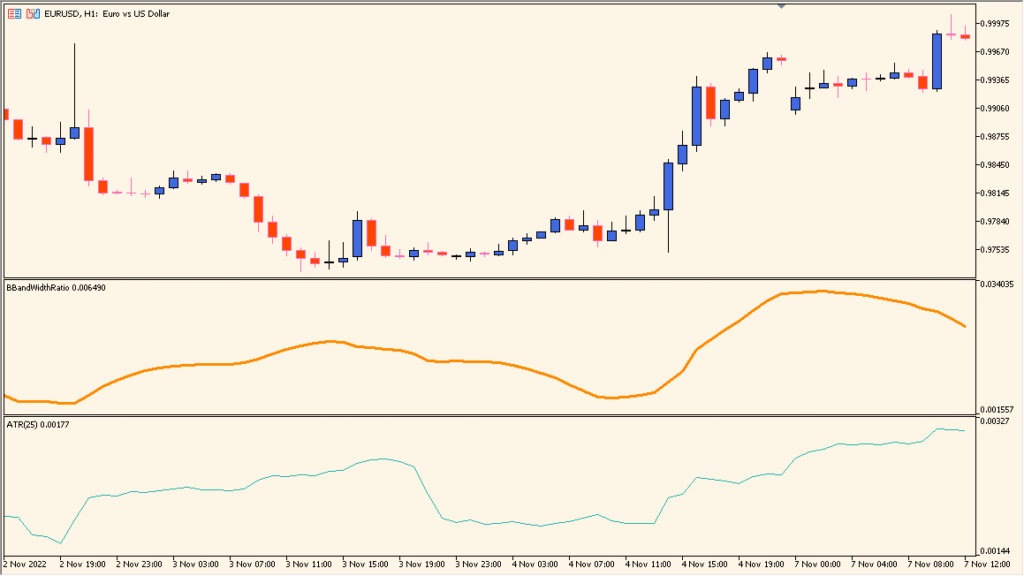
- Confirm market volatility before entering trades based on trend-following strategies.
- Filter out trades during quiet markets when the ratio is flat or low.
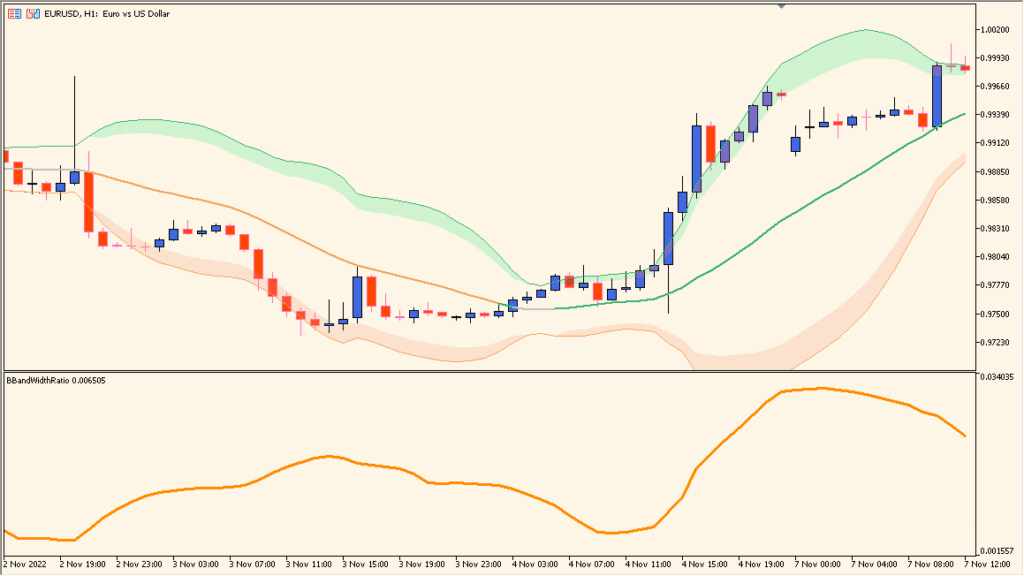
- Combine with Bollinger Bands or other momentum indicators for better timing.
This indicator is especially helpful for breakout and volatility-based systems where timing entries around periods of expansion and contraction is key.
Parameter Explanations
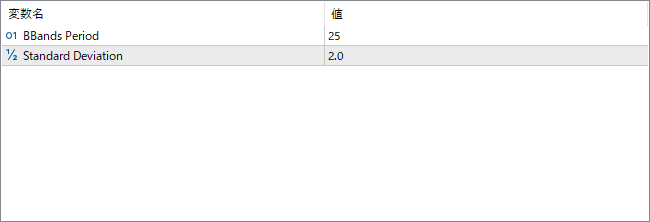
BBands Period
Sets the number of periods used to calculate the Bollinger Bands. A longer period smooths the ratio curve and focuses on broader volatility trends, while a shorter period reacts more quickly to price changes.
Standard Deviation
Defines the number of standard deviations used for the Bollinger Band calculation. Increasing this value widens the bands and can affect the sensitivity of the width ratio to price volatility.