Overview of the Boa ZigZag Price Indicator

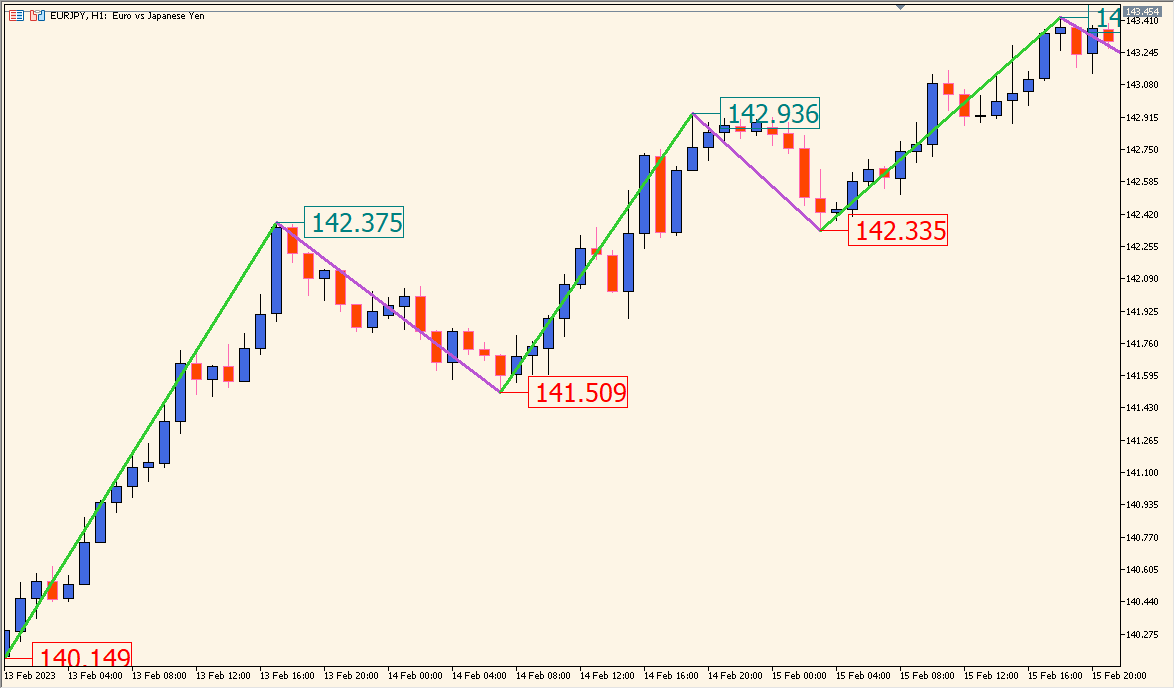
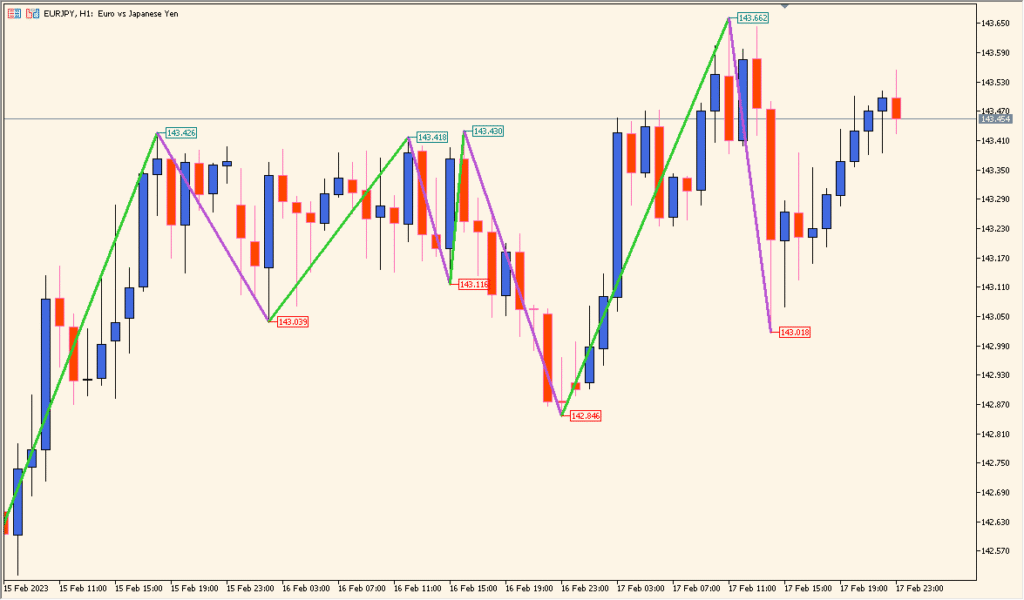
The Boa ZigZag Price Indicator for MT4 highlights swing highs and lows on the chart and displays their price values directly at each turning point. It draws ZigZag lines to simplify price structure analysis and filters out minor fluctuations, helping traders see the dominant market waves clearly. This makes it easier to identify significant highs, lows, and potential reversal zones.
It’s a straightforward tool often used for pattern recognition, swing analysis, and visual confirmation of market structure. The added price labels allow traders to quickly read turning-point prices without manually checking each candle.
How to Use It in Practice
In live trading, the Boa ZigZag Price Indicator can be used to:
- Identify swing highs and lows for trend structure analysis.
- Spot double tops, double bottoms, or head and shoulders patterns more clearly.
- Use swing points as potential support and resistance levels.
- Confirm entries or exits based on recent wave highs and lows.
- Label price levels directly for quick visual reference.
This indicator is especially useful for price action traders who prefer clean charts while still keeping essential structural information visible.
Parameter Explanations
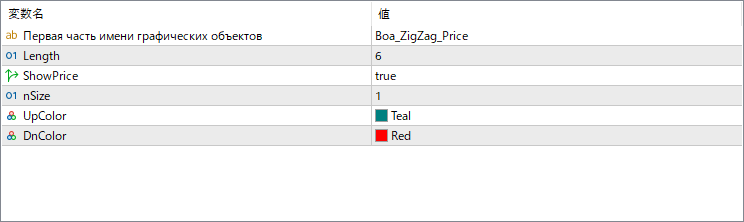
Первая часть имени графических объектов
Defines the prefix used for graphical object names created by the indicator. Mostly for internal identification and does not affect display.
Length
Determines the number of bars used to identify swing points. A higher value produces fewer, more significant ZigZag turns; a lower value makes it more sensitive to small movements.
ShowPrice
Enables or disables the display of price labels at each ZigZag turning point.
nSize
Sets the text size of the price labels displayed on the chart.
UpColor
Specifies the color of the ZigZag lines drawn for upward price movements.
DnColor
Specifies the color of the ZigZag lines drawn for downward price movements.