Overview of the Breakout Bars Trend Indicator
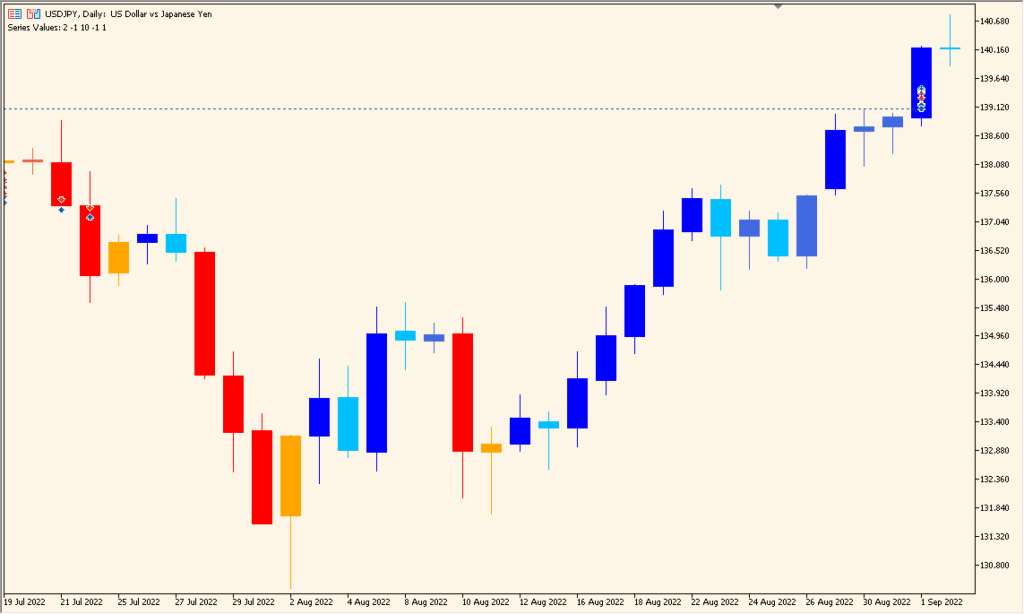
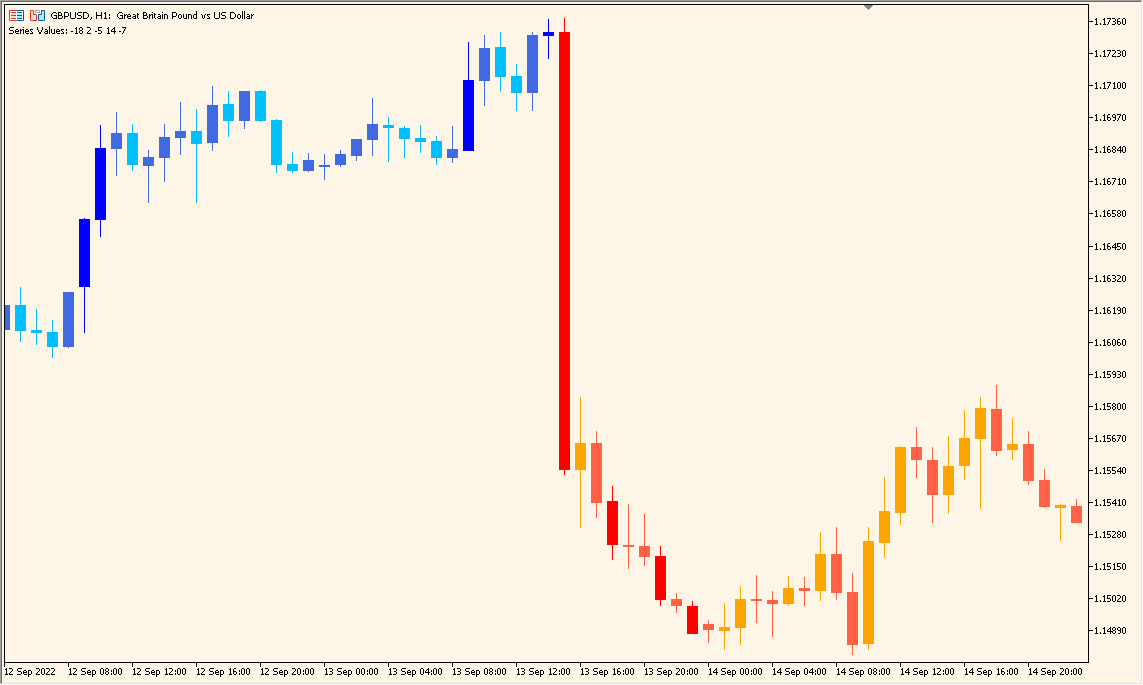
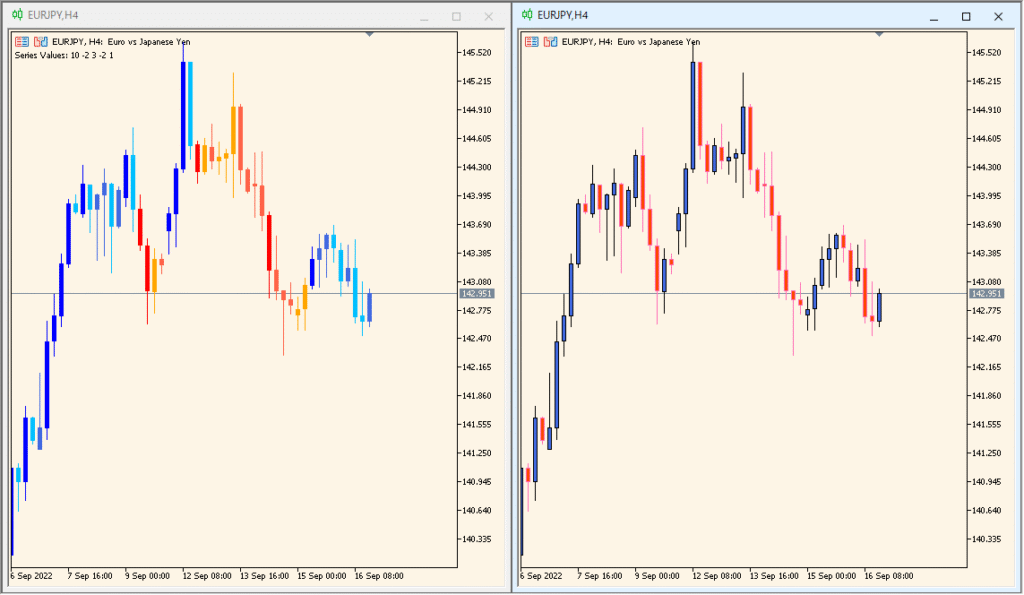
The Breakout Bars Trend indicator highlights momentum-based breakouts by analyzing a sequence of price bars that move strongly in one direction. It helps traders identify potential trend initiation zones and filter out weak or false breakout signals.
This indicator evaluates consecutive bars and measures their combined movement to confirm whether the market is showing a strong breakout trend. It is a useful tool for traders who want to focus on high-momentum price movements rather than random volatility.
How to Use It in Practice
In live trading, the Breakout Bars Trend indicator can be used to:
- Identify strong breakout moments when multiple consecutive bars move in the same direction.
- Confirm the beginning of a new trend after a period of consolidation.
- Spot exhaustion points where the breakout momentum starts to fade.
- Combine with volume or volatility indicators to validate breakout strength.
When the indicator shows a consistent breakout sequence, it signals that price action is likely to continue in that direction. Traders can use it to time entries or avoid sideways market conditions.
Parameter Explanations
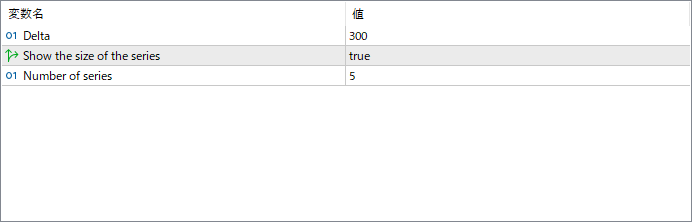
Delta
Defines the minimum price movement required for a bar to be considered part of a breakout series. A higher delta filters out smaller moves and focuses on stronger price swings.
Show the size of the series
When enabled, displays the size or strength of each breakout series directly on the chart for quick visual analysis.
Number of series
Specifies how many consecutive bar sequences the indicator should analyze. Increasing this number allows detection of longer breakout patterns.

—
このインジケーターは、
✅ **Trend(トレンド)** に分類されます。


