Overview of the Bulls and Bears Indicator

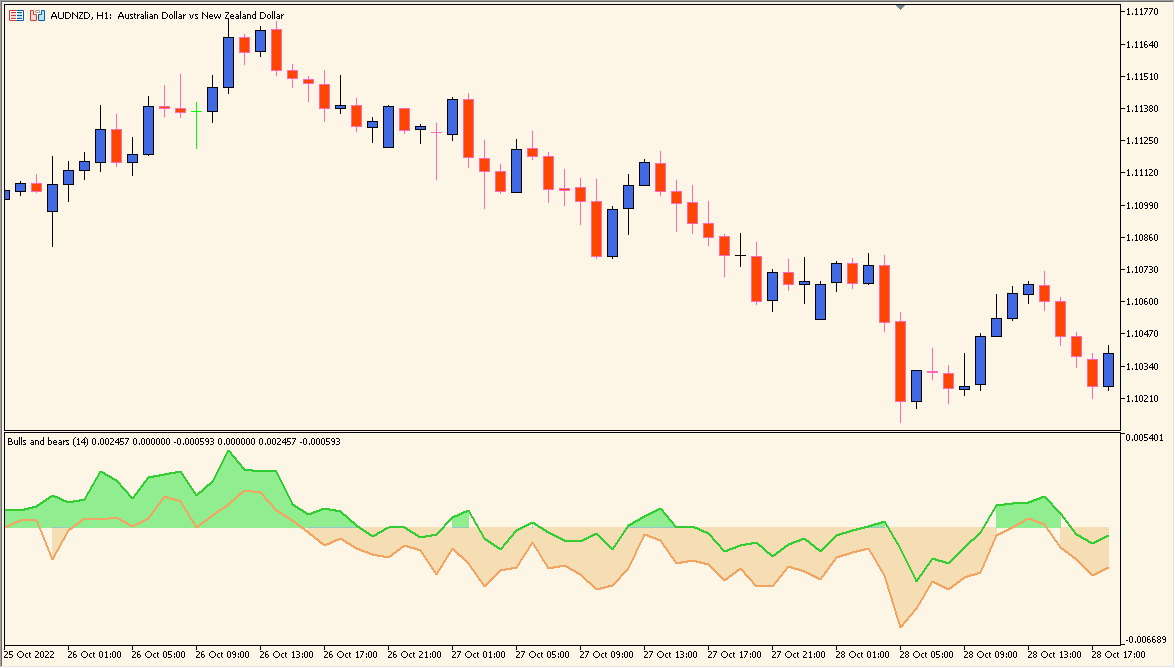
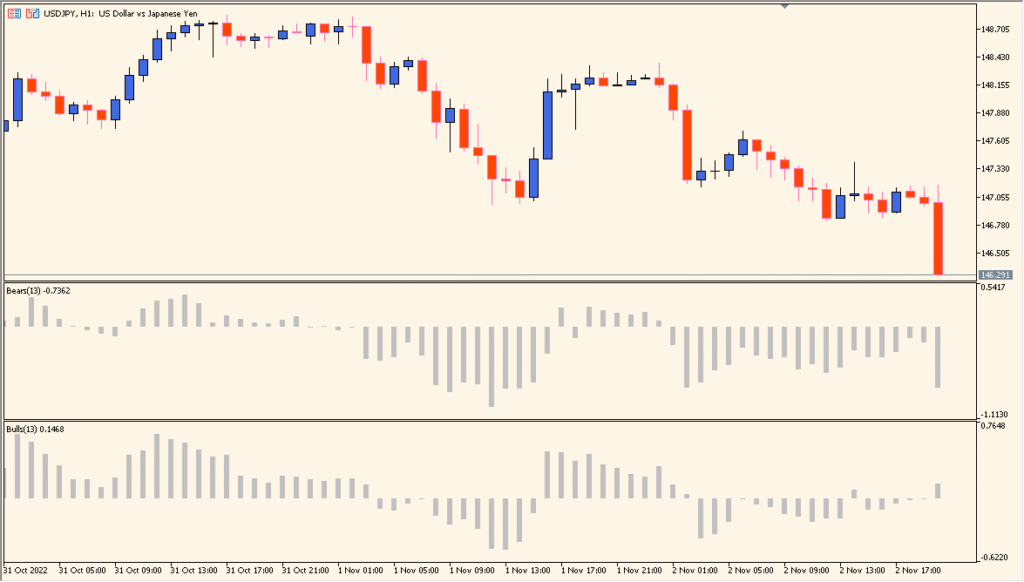
The Bulls and Bears indicator measures the strength of bullish and bearish forces in the market. It helps traders understand whether buyers (bulls) or sellers (bears) currently dominate price movement. The indicator displays two colored areas — typically green for bullish pressure and red or orange for bearish pressure — plotted in a separate window below the main chart.
By comparing these forces over time, traders can easily detect shifts in market sentiment and anticipate possible reversals or trend continuations.
How to Use It in Practice
In trading, the Bulls and Bears indicator can be used to:
- Identify when bullish or bearish pressure is increasing or fading.
- Confirm trend direction — strong bullish values support an uptrend, while strong bearish values confirm a downtrend.
- Detect potential reversal points when the bullish and bearish lines cross or when both weaken simultaneously.
- Combine with oscillators or volume indicators for better accuracy.
This tool is useful for both trend-following and counter-trend traders who want to gauge the underlying strength behind price movements.
Parameter Explanations
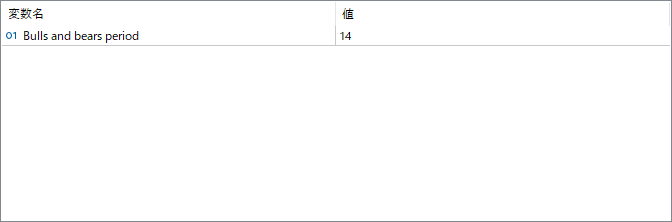
Bulls and bears period
Defines the number of candles used to calculate the average bullish and bearish strength. A shorter period makes the indicator more responsive to recent changes, while a longer period smooths out short-term fluctuations and shows a broader view of market sentiment.