Overview of the Custom List Slideshow Indicator
The Custom List Slideshow indicator displays symbol-related information (such as name or price change) and cycles through a predefined list of instruments automatically at regular intervals. It’s designed to provide quick updates on selected pairs without needing to switch charts manually.
This tool is especially helpful for traders who monitor multiple markets and want to stay updated on various pairs while keeping the workspace clean and focused on one chart window.
How to Use It in Practice
In real trading scenarios, you can use this indicator to:
- Keep track of selected symbols by automatically cycling through them.
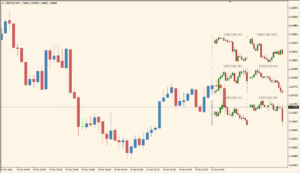
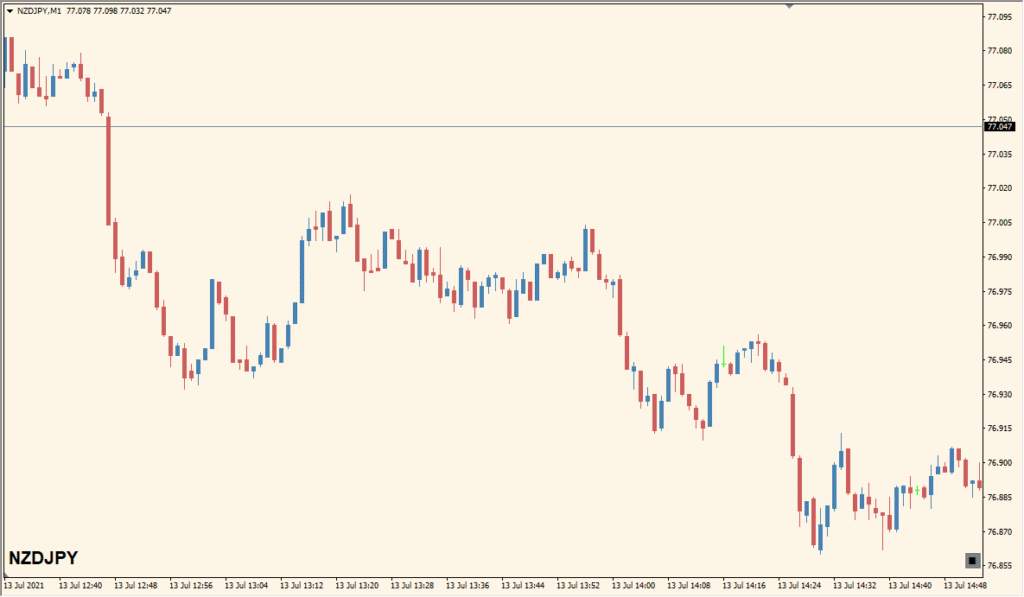
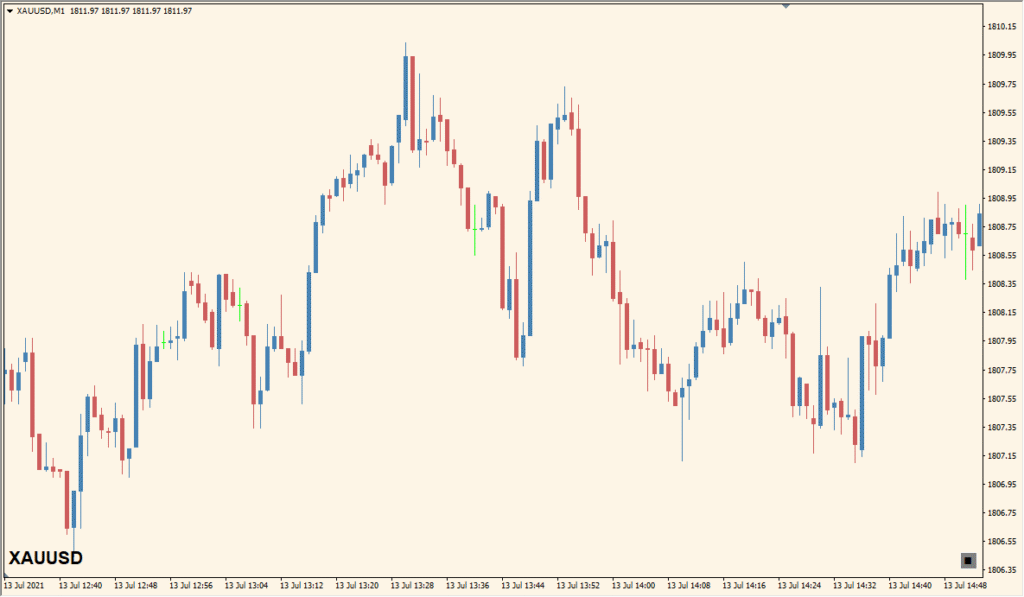
- Display information such as symbol name and price change in a fixed chart corner.
- Customize font, color, and position to match your chart theme and visibility preferences.
- Monitor up to 20 custom instruments in a loop without changing your active chart.
This setup is ideal for traders who want a passive, glanceable view of their watchlist while focusing on another chart or strategy.
Parameter Explanations
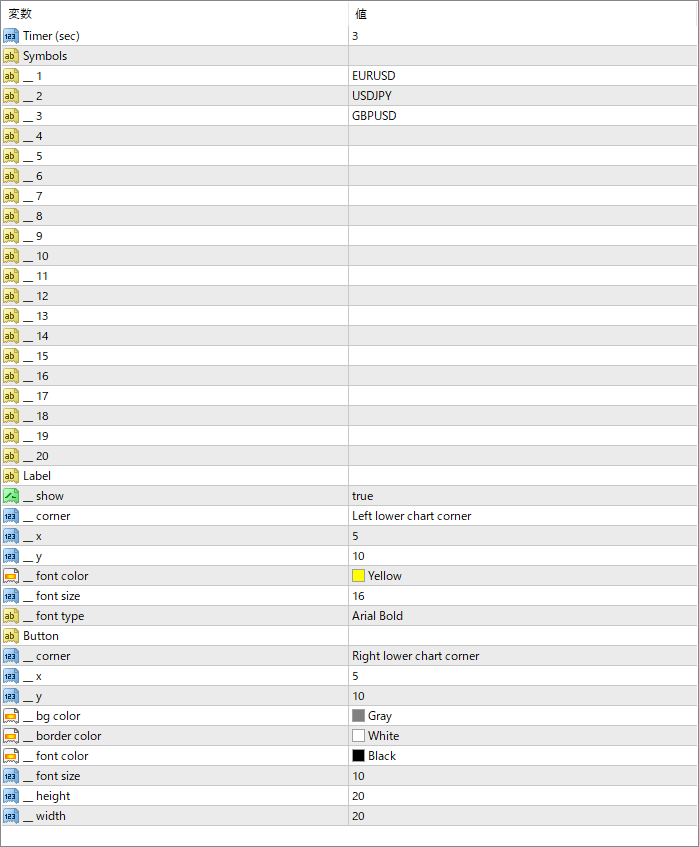
Timer (sec)
Sets the interval time in seconds before switching to the next symbol in the list.
Symbols
Defines the custom list of symbols to cycle through. Up to 20 slots are available (e.g., EURUSD, USDJPY).
Label > show
Enables or disables the text display on the chart showing current symbol info.
Label > corner
Sets the position of the label (e.g., left lower chart corner).
Label > x / y
Adjusts the offset position of the label in pixels from the chosen corner.
Label > font color
Specifies the font color for the label text.
Label > font size
Sets the size of the font used in the label.
Label > font type
Defines the font type used in the display (e.g., Arial Bold).
Button > corner
Specifies where the button (if included) is placed on the chart.
Button > x / y
Sets the horizontal and vertical offset of the button in pixels from the chart corner.