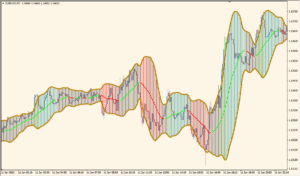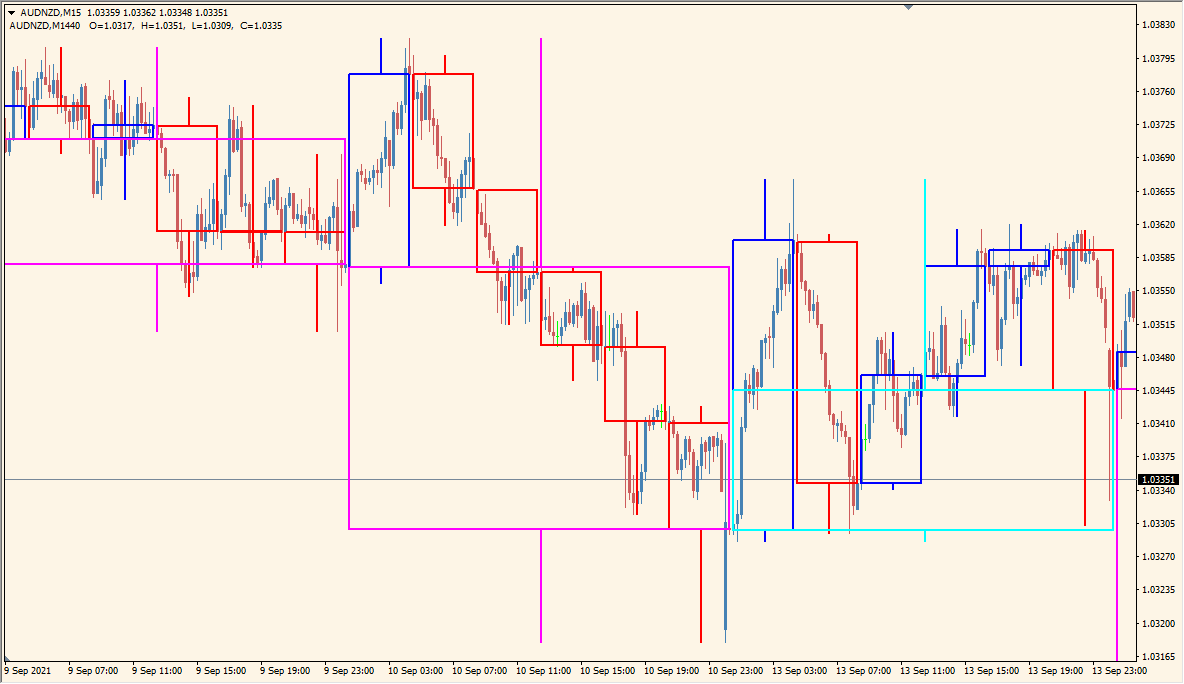
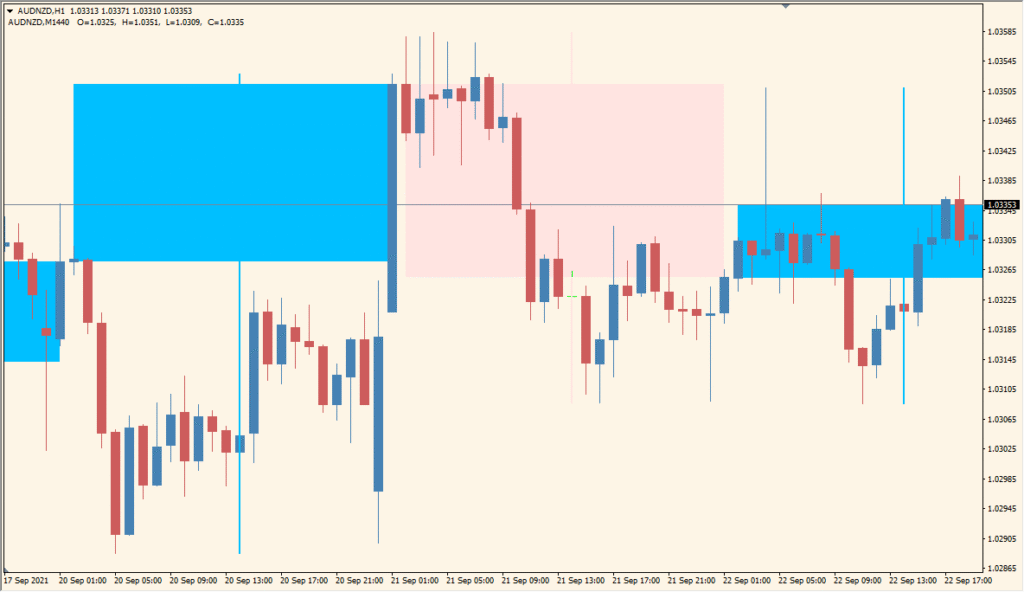
Overview of the CustomCandle6 Indicator
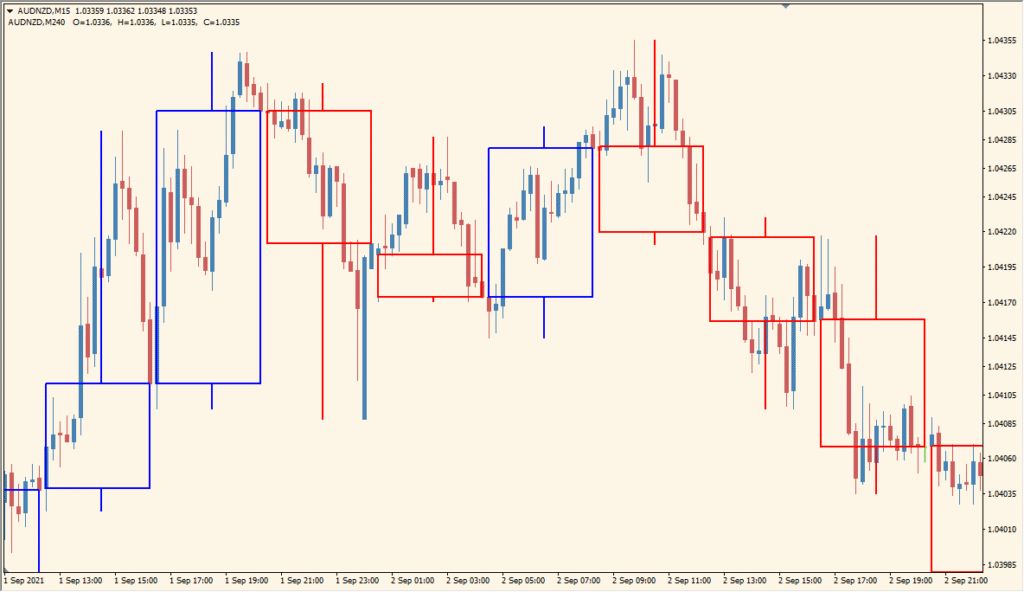
The CustomCandle6 indicator for MT4 overlays candles from a higher timeframe directly onto your current chart. This visual tool helps traders quickly assess higher-timeframe price action without changing charts. Each higher-timeframe candle is displayed as an outlined box using different colors for bullish, bearish, and doji candles.
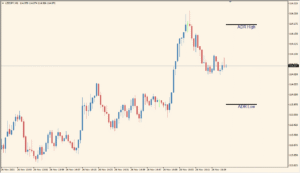
This is useful for multi-timeframe analysis, allowing traders to spot strong trends or key reversal signals from broader timeframes while monitoring price action on lower timeframes.
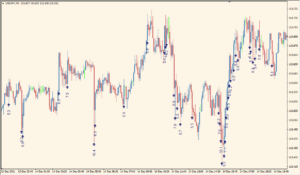
How to Use It in Practice
In trading, you can use CustomCandle6 to:
- Monitor higher timeframe market structure while trading on a lower timeframe.
- Spot support/resistance areas and major candle signals from 4H, Daily, or Weekly charts.
- Combine it with your strategy for better entry confirmation using broader context.
- Visualize higher-timeframe trend direction and candle strength at a glance.
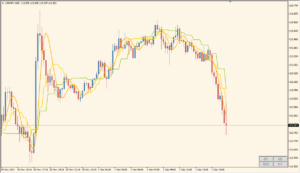
Parameter Explanations
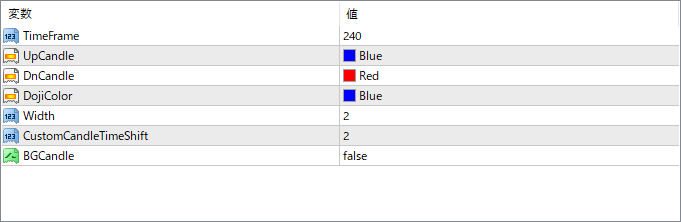
TimeFrame
Sets the timeframe from which to draw the candles (e.g. 240 for H4). This is the source of the overlayed candles.
UpCandle
Defines the color of bullish candles from the selected timeframe.
DnCandle
Defines the color of bearish candles from the selected timeframe.
DojiColor
Sets the color used for doji candles, where open and close prices are almost equal.
Width
Controls the thickness of the outline for each candle box.
CustomCandleTimeShift
Applies a horizontal shift to the overlayed candles, useful to offset them visually from current bars.
BGCandle
If set to true, fills the inside of the overlayed candles instead of just showing their outline.