Overview of the Double Smoothed EMA (MTF) Indicator
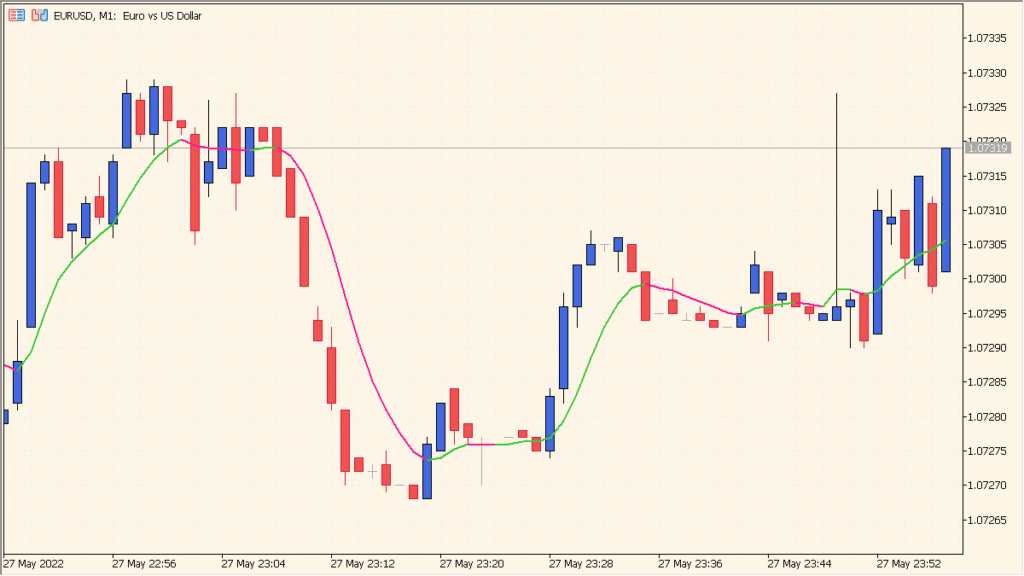
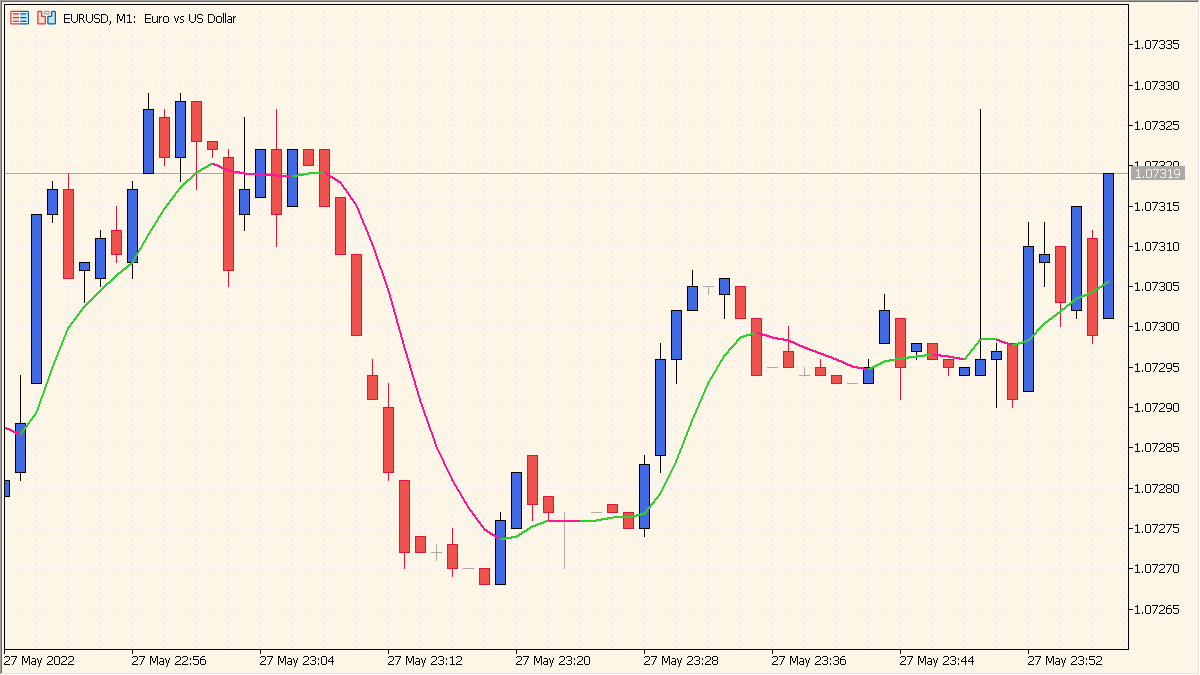
The Double Smoothed EMA (MTF) indicator applies a double exponential smoothing technique to price data, resulting in a smoother moving average line compared to a standard EMA. This helps reduce noise and provides a clearer visualization of the underlying trend direction.
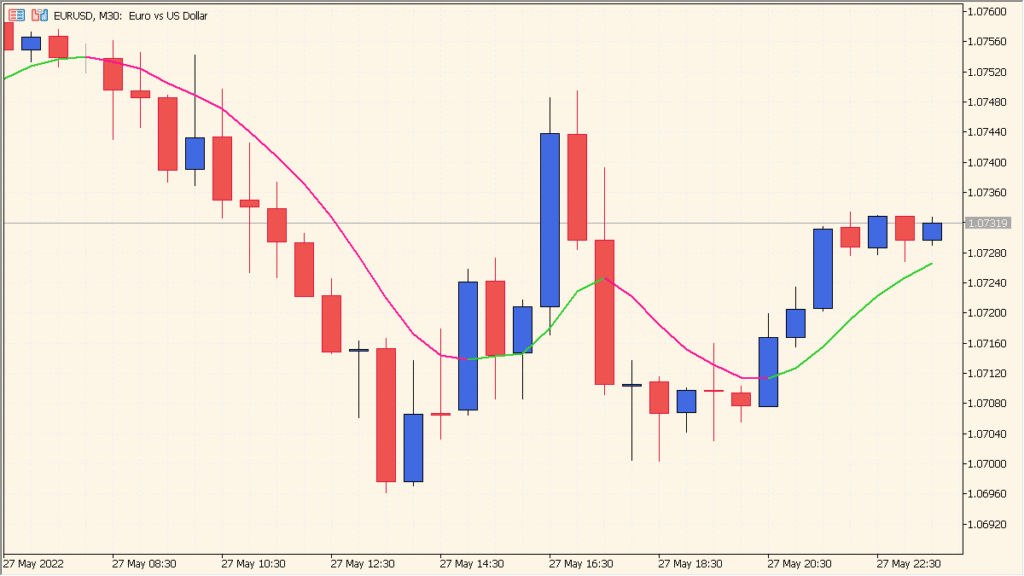
The indicator can also display values from higher timeframes, making it suitable for multi-timeframe analysis. Traders can use it to confirm trend alignment between short-term and higher timeframe charts.
How to Use It in Practice
In practice, the Double Smoothed EMA (MTF) is mainly used for:
- Smoothing out short-term market fluctuations to identify true trend direction.
- Confirming higher timeframe trends when trading on lower charts.
- Using EMA crossovers or slope changes as potential trade signals.
- Filtering out choppy market conditions by observing price relation to the smoothed line.
When the price stays above the smoothed line, it suggests bullish momentum, while staying below indicates bearish sentiment. The smoother nature of this EMA helps avoid false trend shifts caused by short-term volatility.
Parameter Explanations
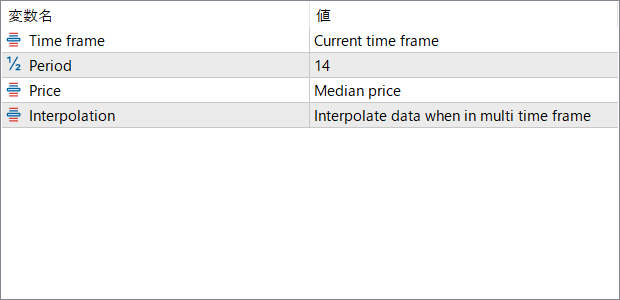
Time frame
Defines which timeframe’s data the indicator uses. You can choose to display the moving average from the current or a higher timeframe (for multi-timeframe analysis).
Period
Sets the number of bars used for EMA calculation. Higher values increase smoothing and reduce responsiveness, while lower values make it more sensitive to price changes.
Price
Specifies which price type is used for the calculation, such as Close, Open, or Median price. Median price helps reduce outlier effects from extreme candle values.
Interpolation
When using higher timeframe data, this option smooths transitions between candles for more accurate visual representation.