Overview of the Indicator
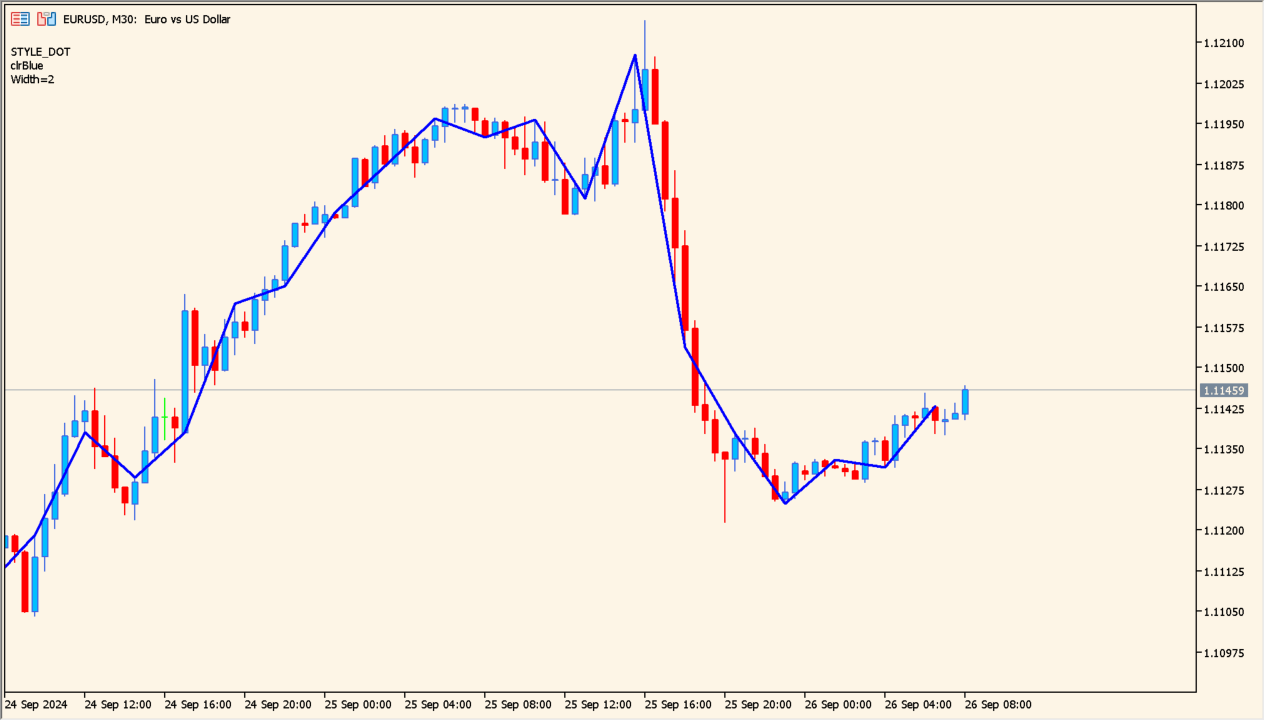
draw_section is a simple visual tool that connects price points over a fixed number of bars. It draws short line segments directly on the chart, making recent price movement easier to follow.
Instead of calculating complex averages, it focuses on dividing price action into small sections. This helps traders visually track micro trends and short-term direction changes.
How to Use It in Practice
In trading, this indicator can be used as a visual guide for short-term structure.
- Identify small trend shifts by watching the angle of each section.
- Spot acceleration when consecutive sections point strongly in one direction.
- Notice potential reversals when the direction of sections changes repeatedly.
- Combine with support and resistance levels to confirm breakout or rejection moves.
It works best as a visual support tool rather than a standalone signal generator.
Parameter Explanations
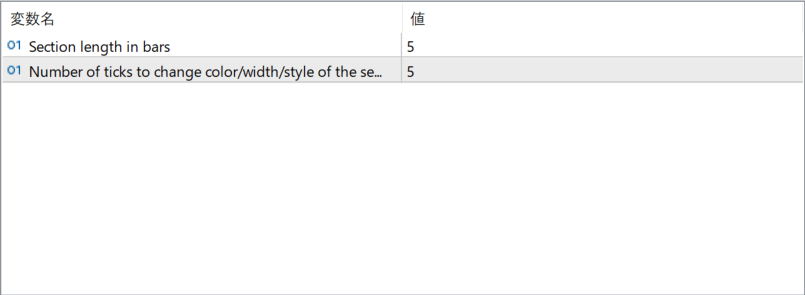
Section length in bars
Defines how many bars are included in each drawn section. A smaller value creates more frequent and reactive segments, while a larger value smooths the structure and reduces noise.
Number of ticks to change color/width/…
Specifies how many ticks of price movement are required before the section changes its visual properties, such as color or width. This helps highlight stronger moves and filter out minor fluctuations.