Indicator Overview
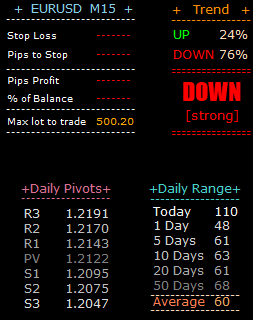
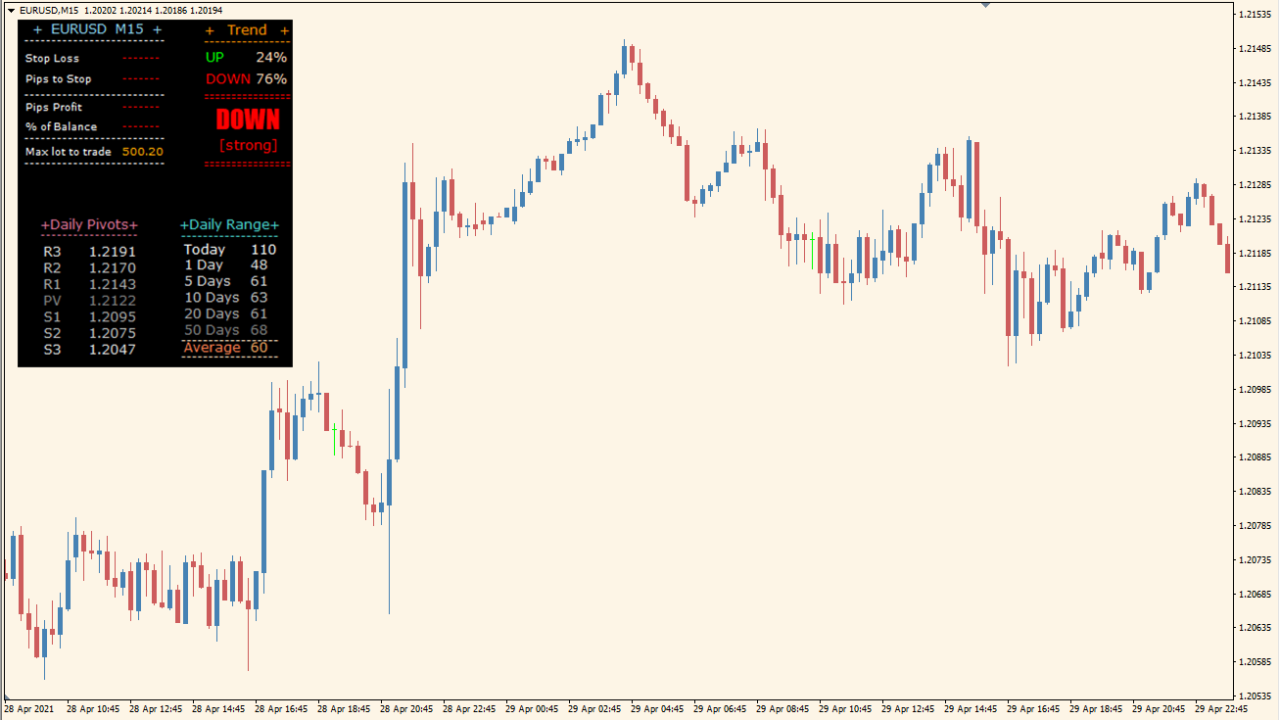
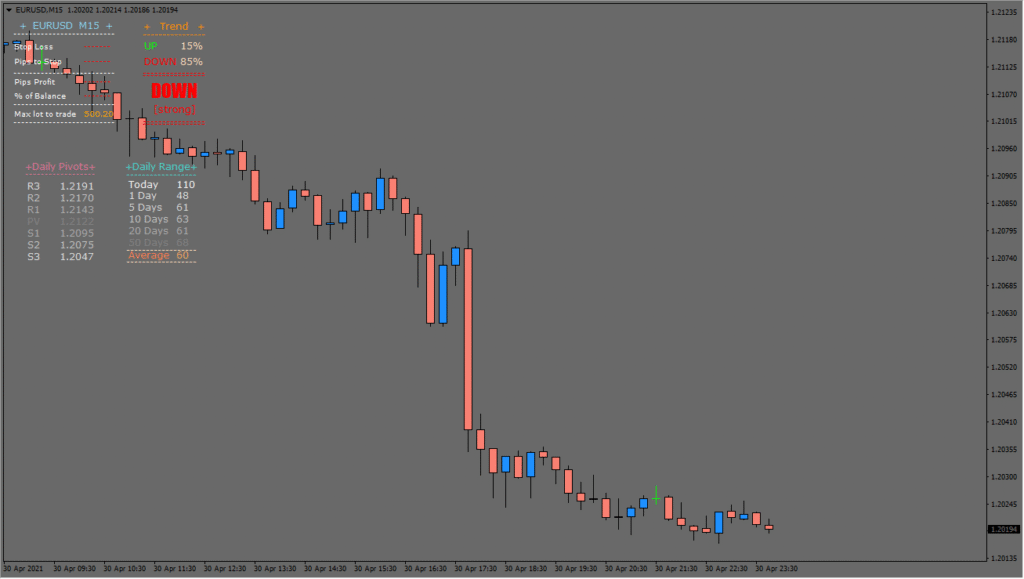
The ferrufx-info-indicator for MT4 displays a compact and information-rich dashboard directly on the chart. It provides traders with trend status, pivot levels, range analysis, and trade information without the need to open multiple indicators. This is especially useful for discretionary traders who rely on a mix of technical tools for decision-making and prefer a clean, integrated layout.
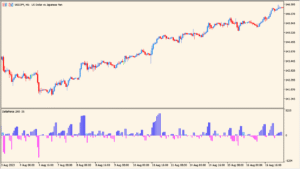
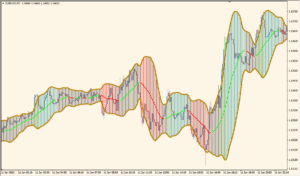
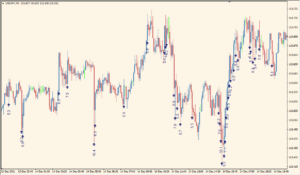
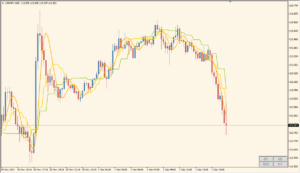
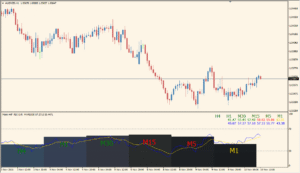
It combines several commonly used elements — such as ADX, RSI, MACD, moving averages, and more — into one panel. This makes it easier to quickly gauge market conditions and confirm signals before placing trades.
How to Use It in Practice
In live trading, ferrufx-info-indicator can help you:
- Quickly assess market strength and direction using built-in trend tools.
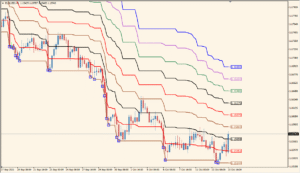
- Reference pivot points, range, and volatility in one place for daily planning.
- Use the trade info section to calculate position sizes and risk based on leverage and pip values.
- Determine whether the market is in a trending or ranging state using visual cues and indicators.
This indicator is great for manual traders who want data-driven confirmation without cluttering the screen.
Parameter Explanations

box_trade_analysis
Shows or hides the “Trade Info Box” which contains leverage and pip value details.
X_trade_analysis
Horizontal position of the Trade Info Box on the chart.
Y_analysis
Vertical position of the Trade Info Box on the chart.
box_trend
Enables or disables the display of the Trend Box section.
X_trend
Horizontal offset for positioning the Trend Box.
Y_trend
Vertical offset for the Trend Box.
box_pivots
Toggles the Pivots Box visibility.
X_pivots
Sets the horizontal position of the Pivots Box.
Y_pivots
Sets the vertical position of the Pivots Box.
box_range
Shows or hides the Range Box which displays volatility/range information.
X_range
Horizontal location of the Range Box.
Y_range
Vertical location of the Range Box.
AccountMini
Shows basic account info like leverage, pip value, etc.
LeverageToTrade
Sets the leverage used for position size calculation.
PipValue
Manually defines the pip value used in risk calculation.
TrendStrongLevel
Threshold level used to define strong trends for display.
display_fast_MA
Displays the fast moving average status in the trend section.
display_medium_MA
Displays the medium moving average status.
display_slow_MA
Displays the slow moving average status.
display_CCI
Enables the CCI indicator in the trend evaluation.
display_MACD
Includes MACD data in the dashboard.
display_ADX
Displays ADX trend strength values.
display_BULLS
Shows Bull Power values.
display_BEARS
Shows Bear Power values.
display_STOCH
Enables Stochastic Oscillator readings.
display_RSI
Displays the RSI reading.
display_FORCE
Includes Force Index data.
display_MOMENTUM
Shows the Momentum indicator value.