Overview of the Highest High – Lowest Low SR Indicator

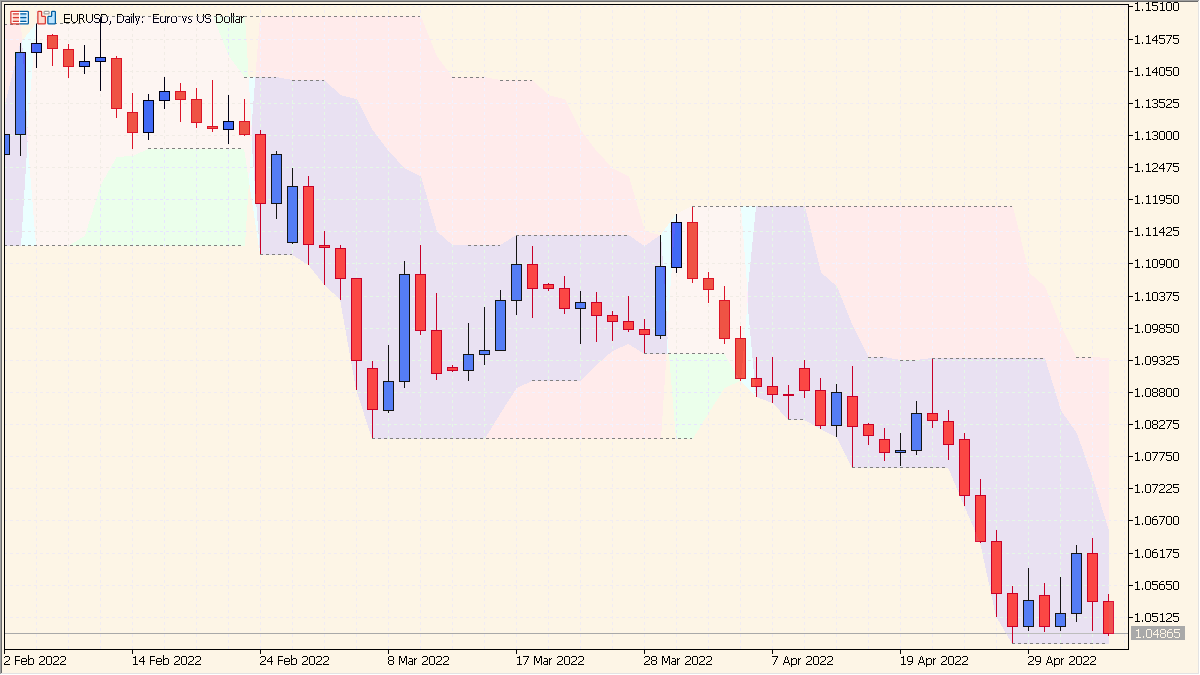
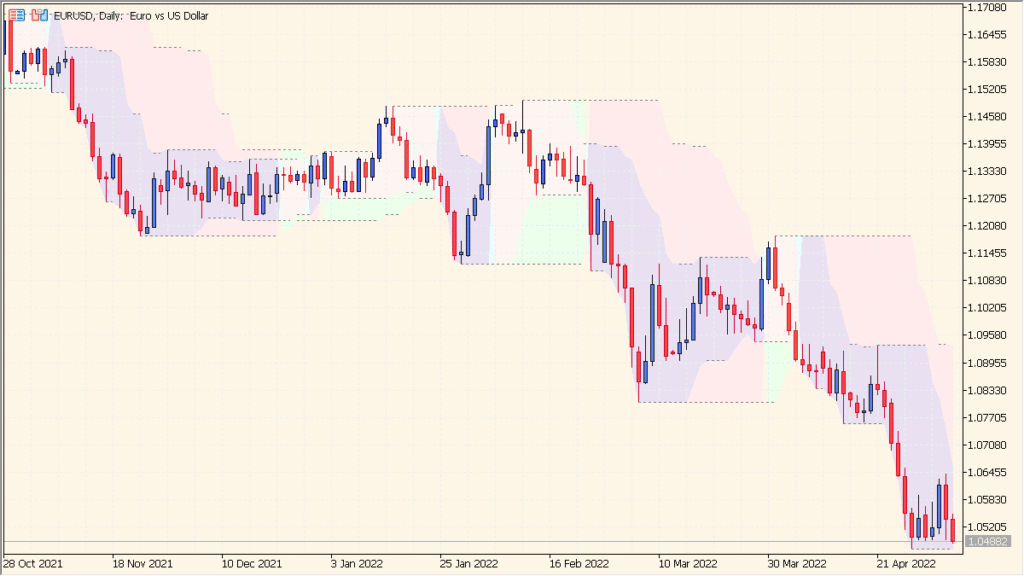
The Highest High – Lowest Low SR indicator plots dynamic support and resistance zones based on the most recent highest highs and lowest lows over user-defined periods. It helps traders visualize short-term and long-term market structure by showing where price has recently reversed or consolidated. The indicator automatically updates as new candles form, providing continuously adapting S/R zones.
By combining fast and slow periods, it offers two layers of structure — one for short-term swings and one for broader market context. This makes it useful for identifying breakout areas, retracement zones, or potential reversal points.
How to Use It in Practice
In practical trading, this indicator can be used to:
- Identify short-term support and resistance zones using the “fast” period.
- Spot longer-term structural levels using the “slow” period.
- Plan entries and exits around these zones, watching for breakouts or rejections.
- Combine with oscillators or trend filters to confirm trade direction near the zones.
Since it reacts dynamically to price action, it’s suitable for both day trading and swing trading, especially in markets with clear range or breakout behavior.
Parameter Explanations
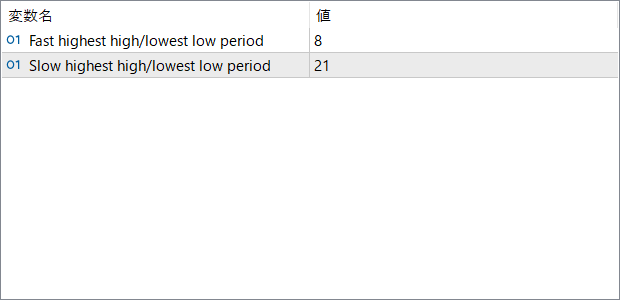
Fast highest high/lowest low period
Defines the number of bars used to calculate the fast dynamic zone. Shorter periods respond quickly to recent price action and highlight short-term support and resistance.
Slow highest high/lowest low period
Defines the number of bars used for the slow dynamic zone. Longer periods smooth out noise and display more stable, higher timeframe support and resistance areas.