Overview of the JFAllStochastic Indicator
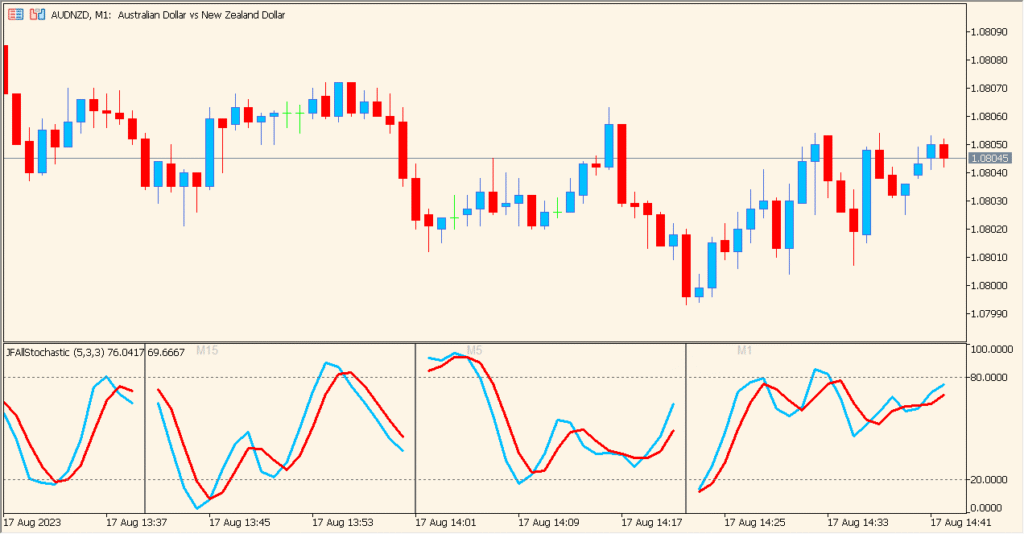
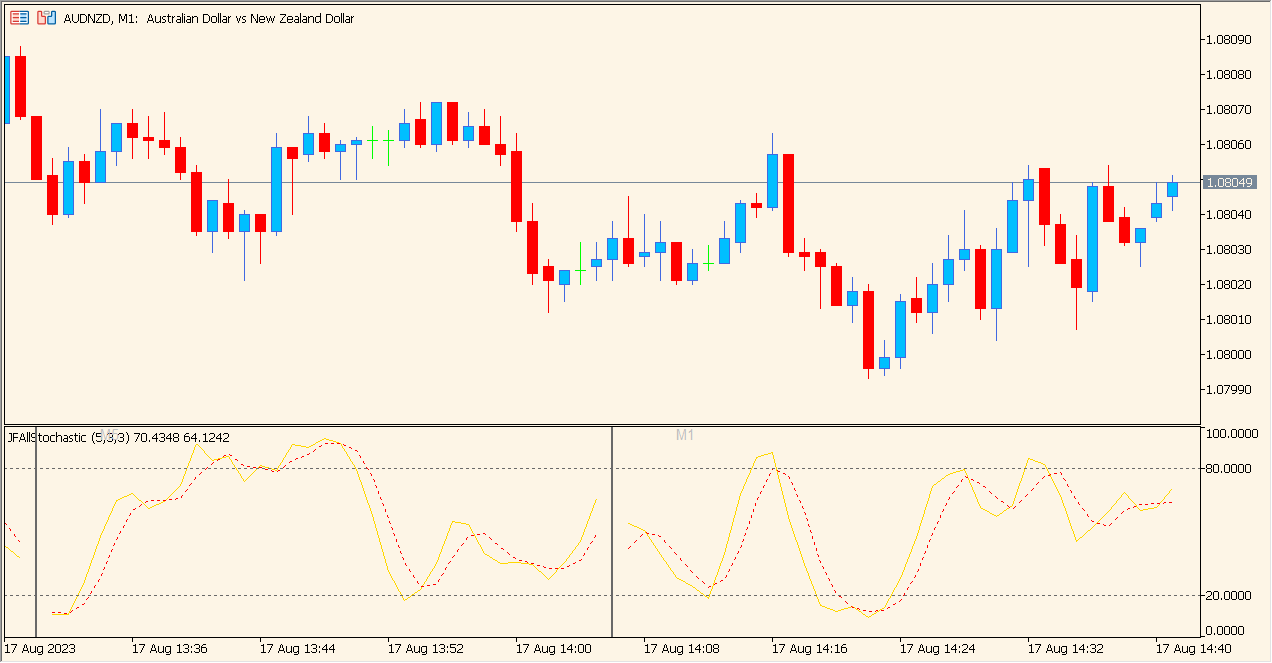
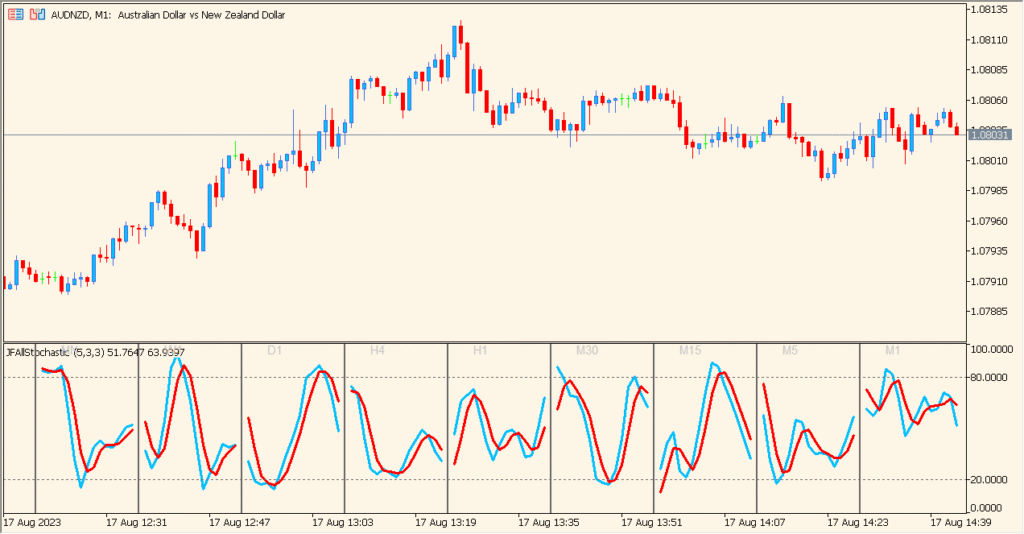
The JFAllStochastic indicator for MT5 displays Stochastic Oscillators from multiple timeframes in one stacked panel. It provides a quick visual comparison of momentum conditions across several periods without switching charts. Each timeframe section shows the %K and %D lines and updates in real time, making it easier to spot alignment or divergence between timeframes.
The indicator works by calculating the Stochastic values separately for each selected timeframe using the chosen K period, D period, slowing, and price field. It then arranges them in individual mini-windows inside a single panel.
How to Use It in Practice
In live trading, the JFAllStochastic indicator can help you:
- Check momentum direction across several timeframes at once.
- Look for alignment (e.g., all timeframes showing overbought or oversold conditions).
- Spot early reversal signals when lower timeframes turn before higher ones.
- Avoid trades when different timeframes are conflicting.
This makes it suitable for traders who base decisions on multi-timeframe momentum confirmation.
Parameter Explanations
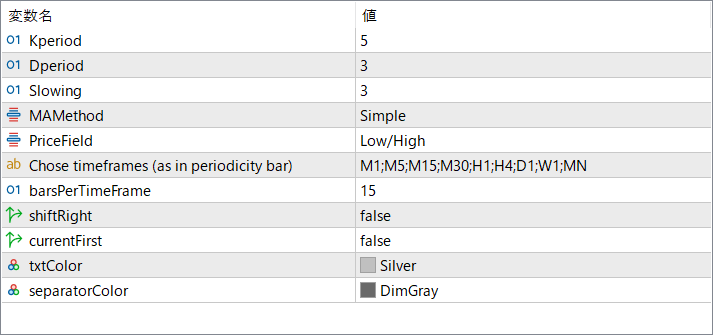
Kperiod
Sets the lookback period for the Stochastic’s %K calculation. A larger value smooths the oscillator and reduces noise.
Dperiod
Defines the smoothing period for the %D line. This controls how responsive or slow the signal line becomes.
Slowing
Adds additional smoothing to the %K calculation, reducing fast fluctuations.
MAMethod
Selects the moving average method used in the smoothing process (such as Simple or other MA types).
PriceField
Chooses which price set is used in the Stochastic formula (e.g., Low/High or Close/Close).
Chose timeframes (as in periodicity bar)
Lists the timeframes displayed in the panel. Each one generates its own Stochastic plot.
barsPerTimeFrame
Controls how many bars are shown horizontally for each timeframe section.
shiftRight
Moves the entire panel to the right side of the chart when enabled, leaving spacing on the left.
currentFirst
Displays the current timeframe at the top of the panel when set to true. If false, the order follows the list sequence.
txtColor
Sets the color of the labels shown inside each timeframe panel.
separatorColor
Defines the color of the horizontal separators between each timeframe section.