Indicator Overview
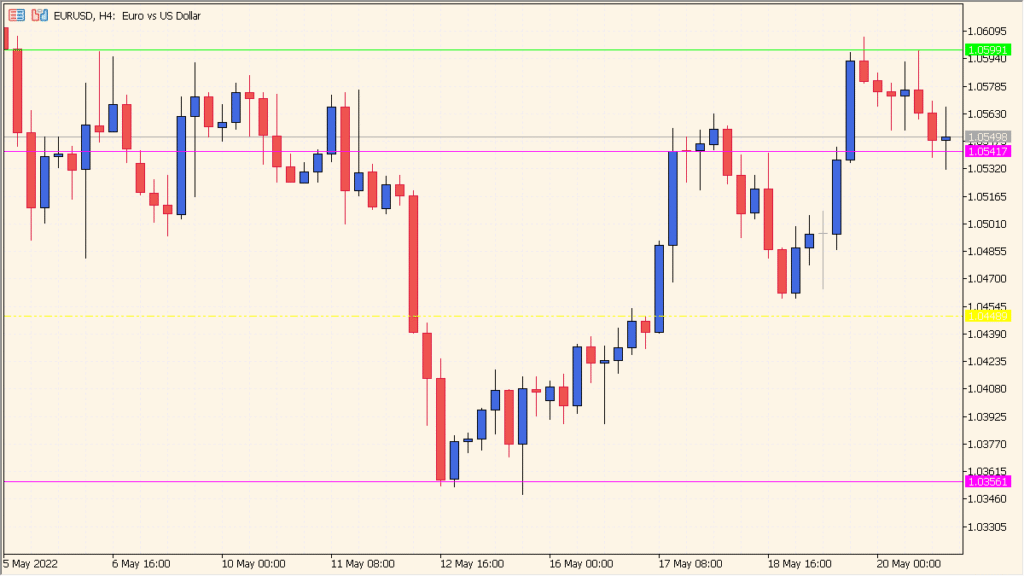
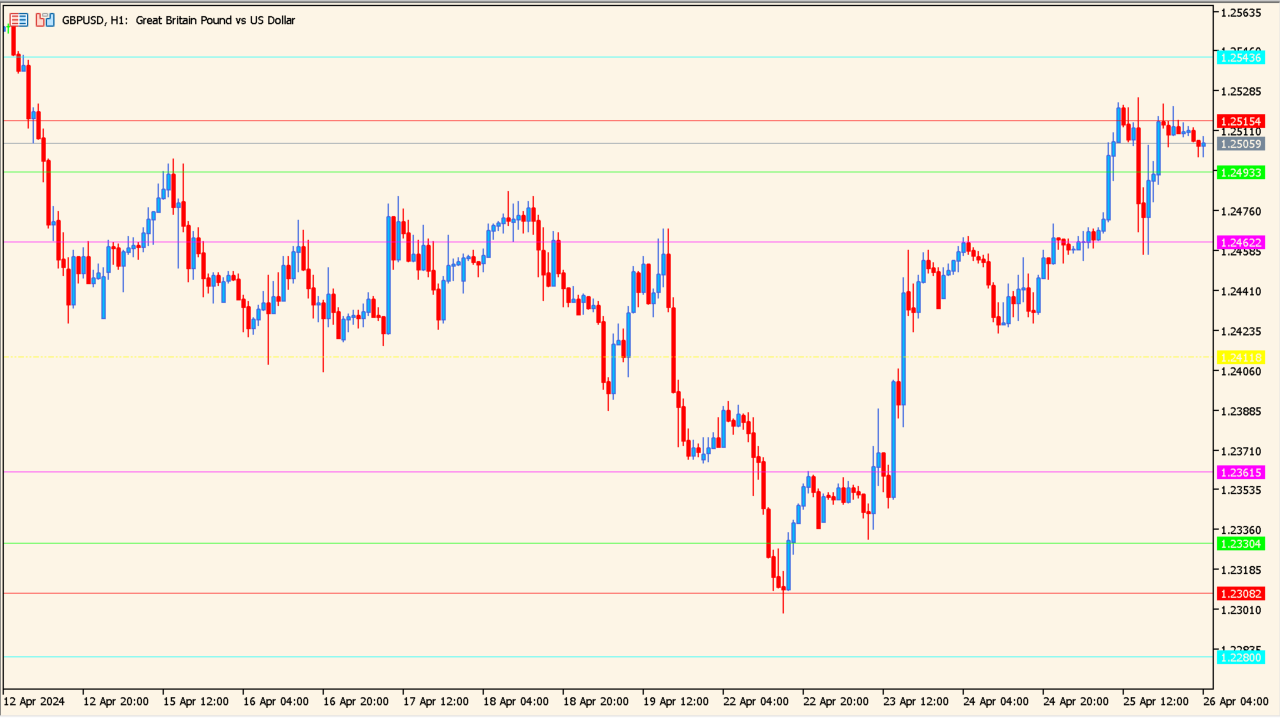
JFPivot is a pivot point indicator that draws clear and structured support and resistance levels directly on the chart. It calculates pivot, support, and resistance lines based on higher-timeframe price data, making market structure easy to read at a glance.
The indicator supports both standard and Fibonacci-style pivot calculations and automatically adjusts to time zones and broker candles. This makes it suitable for intraday and swing traders who rely on consistent reference levels.
How to Use It in Practice
In real trading situations, JFPivot can be used to:
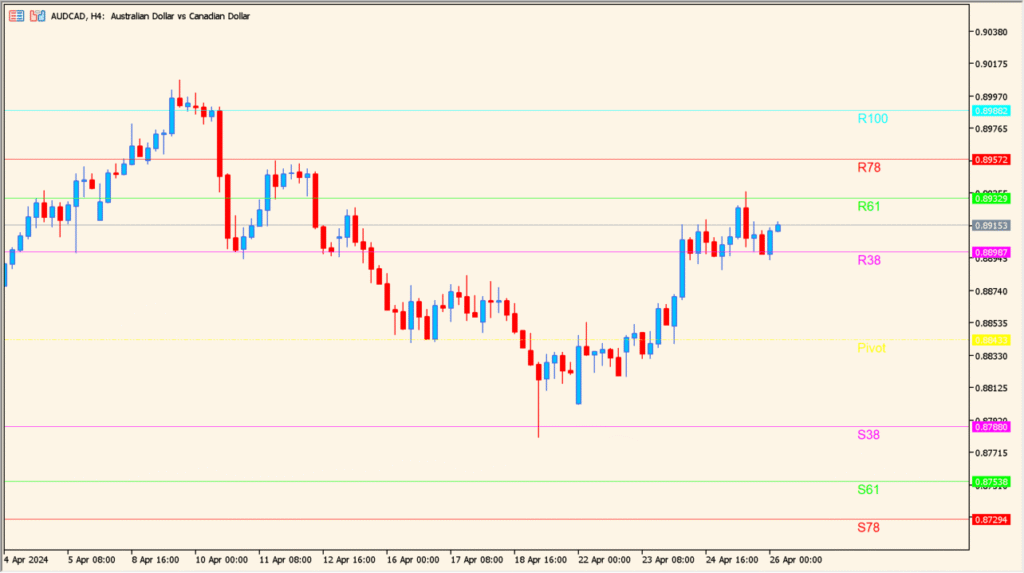
- Identify key support and resistance areas before price reaches them.
- Plan entries and exits around pivot, S38, S61, R38, and R61 levels.
- Judge market bias by observing whether price holds above or below the main pivot.
- Combine with price action or oscillators to confirm reversals or breakouts.
This indicator works best as a structural tool rather than a signal generator. It provides context and reference points rather than direct buy or sell signals.
Parameter Explanations
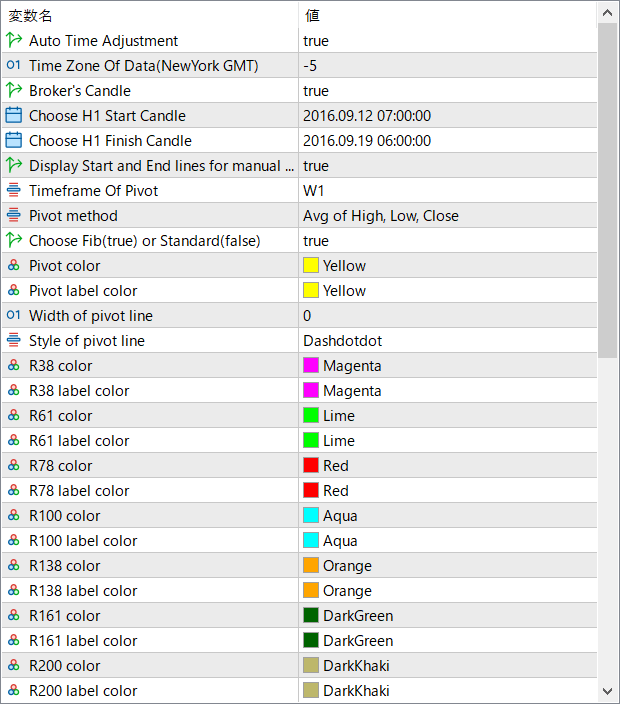
Auto Time Adjustment
Automatically aligns pivot calculations with the correct trading session based on time zone settings.
Time Zone Of Data (NewYork GMT)
Defines the reference time zone used for pivot calculations, typically aligned with the New York trading session.
Broker’s Candle
Uses the broker’s candle structure when calculating pivot levels.
Choose H1 Start Candle
Specifies the starting candle used for manual pivot range calculations.
Choose H1 Finish Candle
Defines the ending candle for manual pivot range calculations.
Display Start and End lines for manual
Shows visual guide lines on the chart when manual pivot ranges are used.
Timeframe Of Pivot
Selects the timeframe from which pivot levels are calculated, such as daily or weekly.
Pivot method
Chooses how the pivot point is calculated, such as using the average of high, low, and close.
Choose Fib (true) or Standard (false)
Switches between Fibonacci-based pivot levels and standard pivot calculations.
Pivot color
Sets the line color of the main pivot level.
Pivot label color
Controls the color of the pivot level label text.
Width of pivot line
Adjusts the thickness of the pivot line.
Style of pivot line
Defines the visual style of the pivot line, such as solid or dashed.
R38 / R61 / R78 / R100 / R138 / R161 / R200 color
Sets the line colors for each resistance level.
S38 / S61 / S78 / S100 color
Sets the line colors for each support level.