Overview of the Indicator
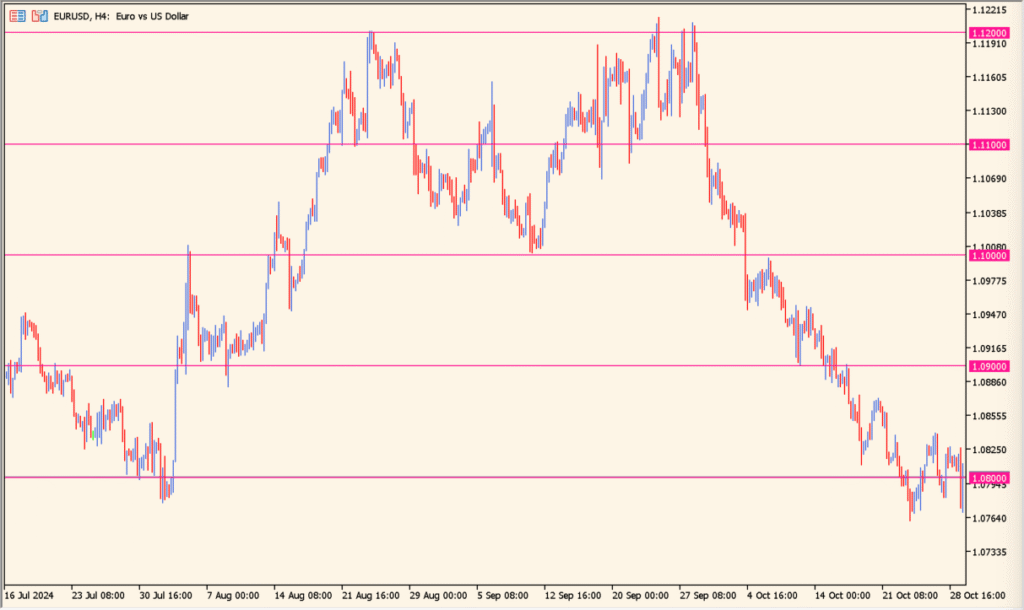
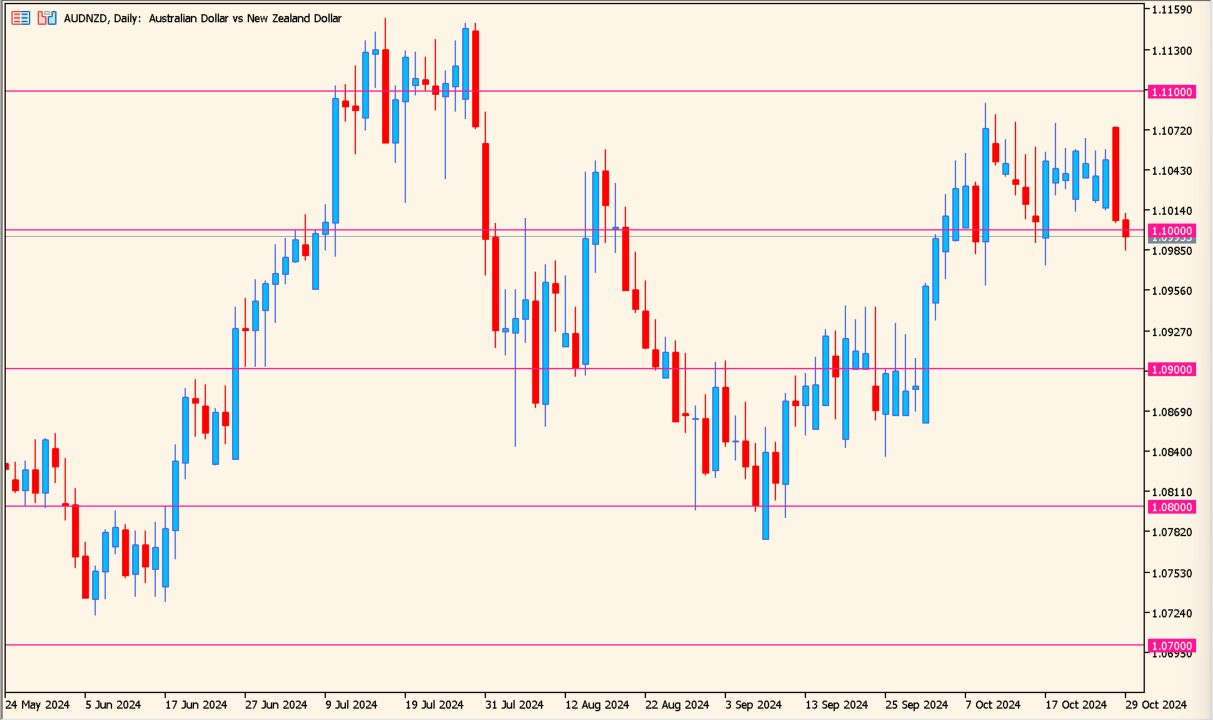
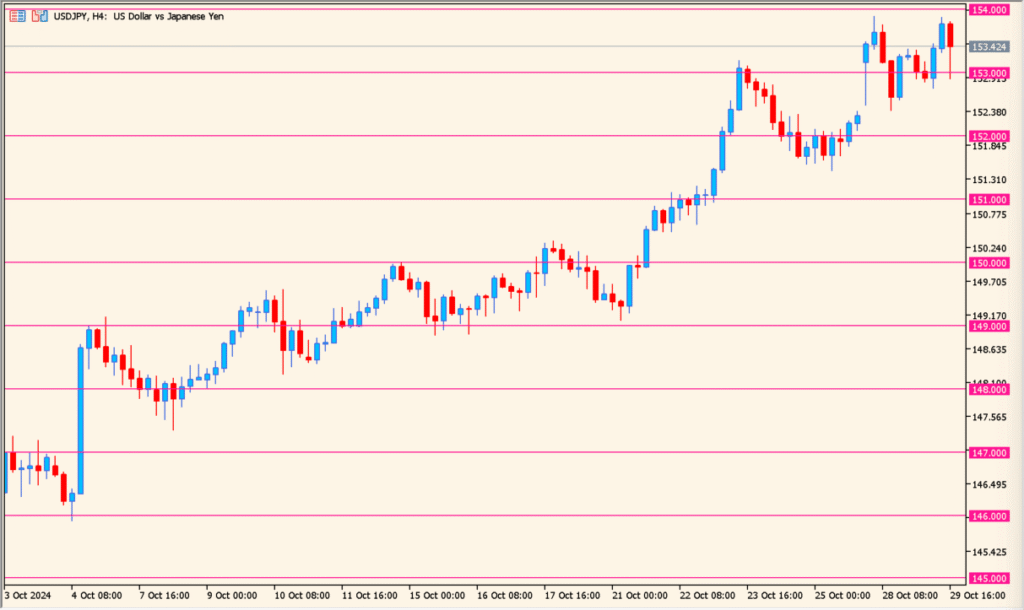
JFRoundNumber is a support and resistance indicator that automatically draws round number levels on the chart. These levels are spaced at fixed price intervals and act as psychological price zones where reactions often occur.
Round numbers such as 157.000 or 157.500 tend to attract attention from traders. This indicator plots those levels across the chart, helping you quickly identify potential reaction areas without drawing them manually.
How to Use It in Practice
In live trading, you can use the indicator in the following ways:
- Watch for price rejection or consolidation near major round numbers.
- Use round levels as logical areas for stop loss or take profit placement.
- Combine with trend or momentum indicators to confirm reactions at key levels.
- Focus on higher-probability setups when price aligns with both structure and round numbers.
This tool is simple but effective. It works on all timeframes and is especially useful for intraday traders who rely on precise entry and exit levels.
Parameters
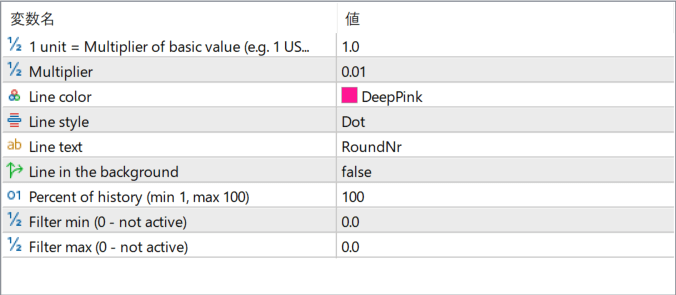
1 unit = Multiplier of basic value (e.g. 1 …)
Defines the base distance between round number levels. Adjusting this value changes how widely spaced the horizontal lines are on the chart.
Multiplier
Works together with the base unit to fine-tune the spacing of levels. Smaller values create more frequent levels, while larger values reduce the number of lines.
Line color
Sets the color of the round number lines displayed on the chart.
Line style
Determines the visual style of the lines, such as solid or dotted.
Line text
Specifies the label text shown next to each round number level.
Line in the background
Controls whether the lines are drawn behind the price candles or in front of them.
Percent of history (min 1, max 100)
Defines how much historical chart data the lines are drawn across. Lower values limit the display to more recent price action.
Filter min (0 – not active)
Sets a minimum price filter. Levels below this value will not be displayed when the filter is active.
Filter max (0 – not active)
Sets a maximum price filter. Levels above this value will not be displayed when the filter is active.