Indicator Overview

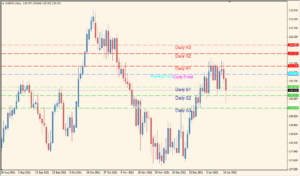
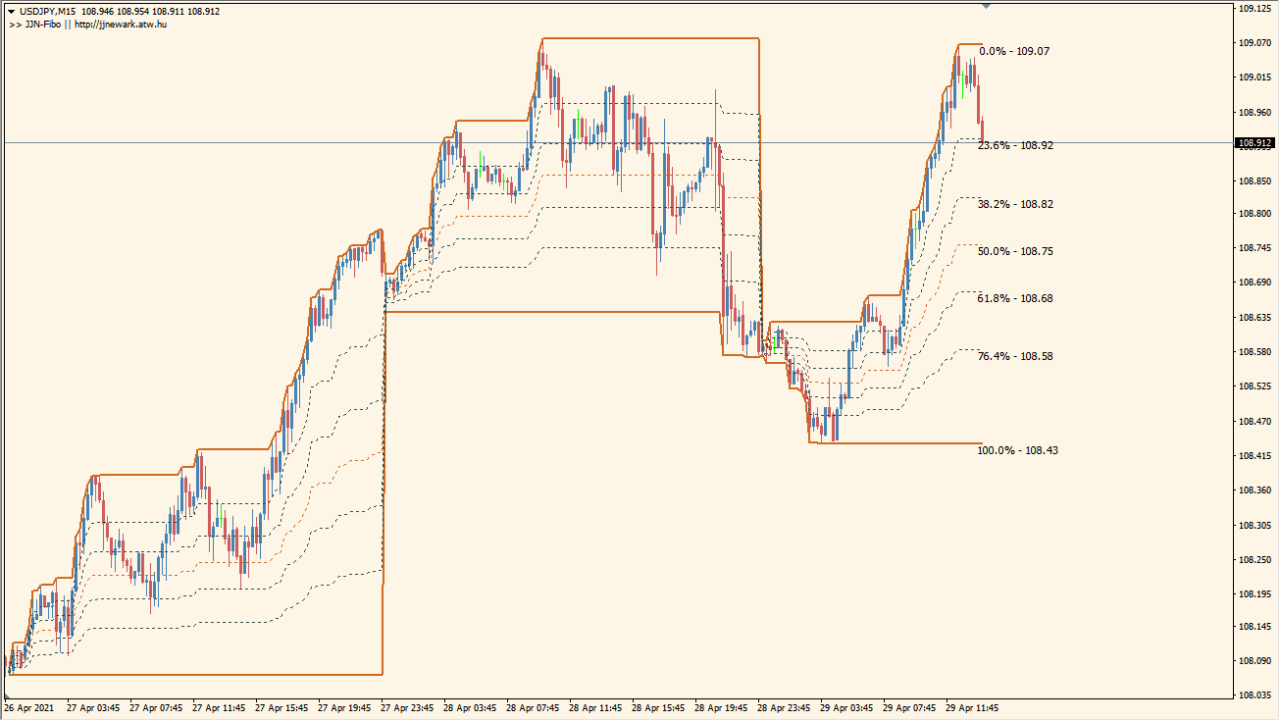
The JIN-Fibo indicator for MT4 automatically draws Fibonacci retracement levels based on a higher timeframe. This helps traders identify key support and resistance levels derived from broader market movements, even when viewing a lower timeframe chart. The tool is useful for those who incorporate multi-timeframe analysis into their technical strategy.
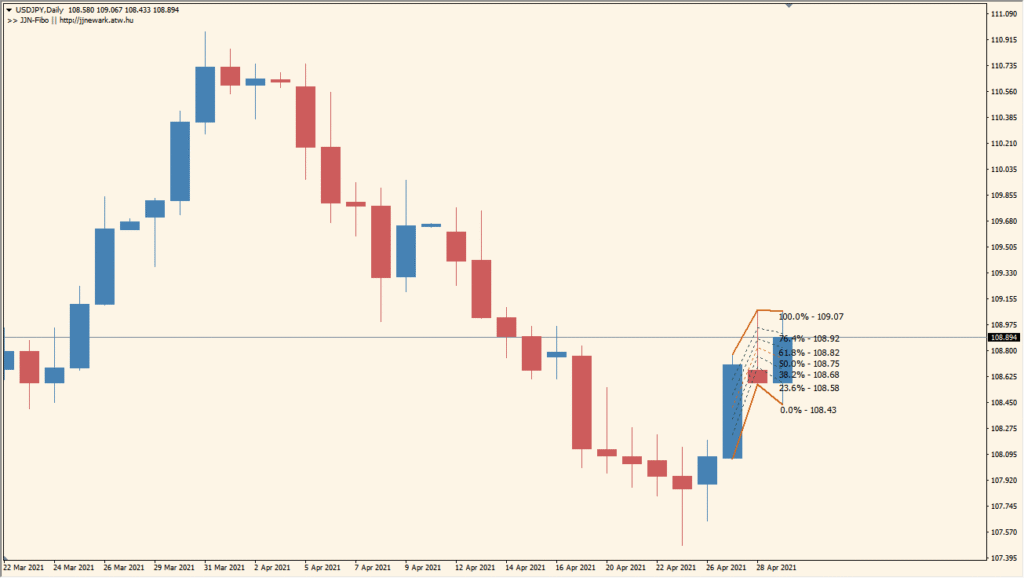
Fibonacci levels are calculated from the latest significant swing high and low within the specified base timeframe. These levels are then displayed directly on the current chart, offering a clearer picture of possible retracement or breakout points.
How to Use It in Practice
In practical trading, the JIN-Fibo indicator allows you to:
- Identify potential reversal or continuation zones using higher-timeframe Fibonacci levels.
- Combine lower timeframe entries with stronger support/resistance zones from higher frames.
- Use it for trend-based strategies by monitoring the reaction at each retracement level.
- Set stop-loss and take-profit levels relative to reliable swing points.
This is especially effective for swing traders and intraday traders who want to align their entries with the broader market structure.
Parameter Explanations

ProcessedUnits
Specifies how many historical swing points the indicator should process when calculating Fibonacci levels.
TextColor
Sets the color of the Fibonacci level labels displayed on the chart.
Help_For_BasisTF
A reference note showing how to configure the timeframe format. It includes example codes like M:43200 for monthly or D1:1440 for daily.
BasisTF
Defines the base timeframe (in minutes) from which the Fibonacci retracement is drawn. For example, 1440 means Daily timeframe.
Help_for_DisplayDecimals
Provides guidance for decimal precision. Used only in version 4.5 of the platform.
DisplayDecimals
Sets the number of decimal places shown on the Fibonacci price labels.