Overview of the Indicator
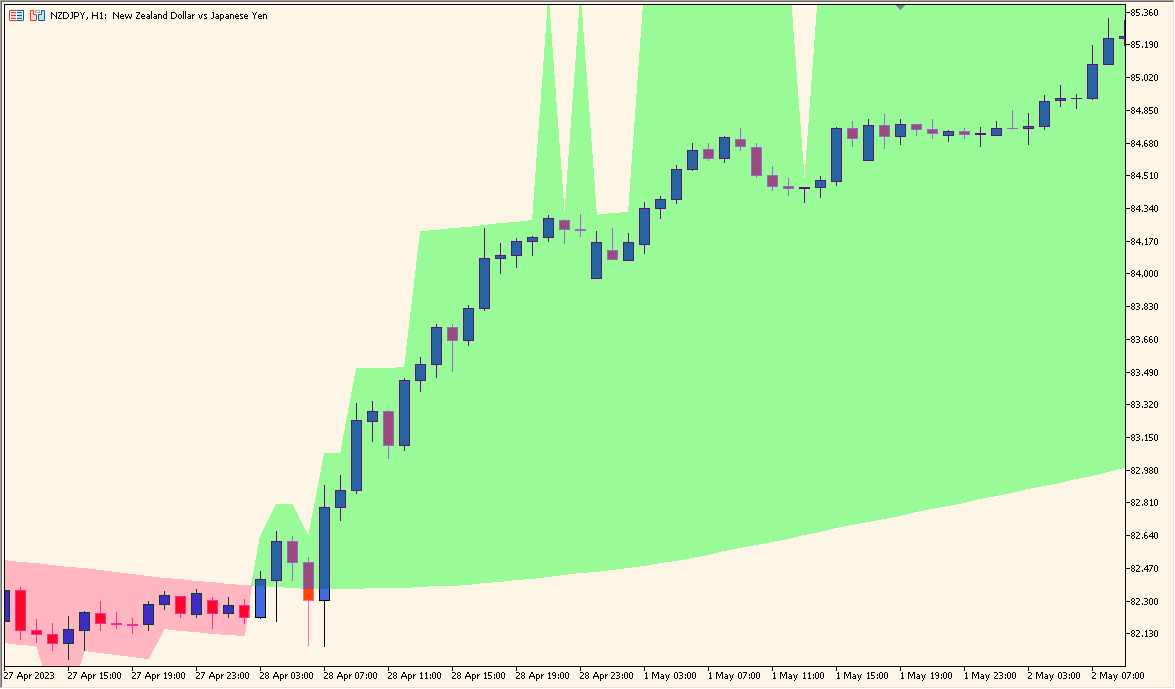
This indicator displays a shaded zone based on a moving average and a volatility range around it. The shaded area helps visualize the broader trend direction and how far price is extending from the central MA. It gives a quick sense of whether the market is trading near the upper or lower edge of the zone, making trend conditions easier to interpret at a glance.
The concept is straightforward: the indicator plots an MA, then expands a band around it using deviation values. The resulting zone highlights trend pressure and market positioning without adding unnecessary complexity.
How to Use It in Practice
In real chart analysis, this indicator can be used to:
- Identify trend direction by checking the slope of the band.
- See when price approaches the upper or lower boundary, which can signal exhaustion or continuation.
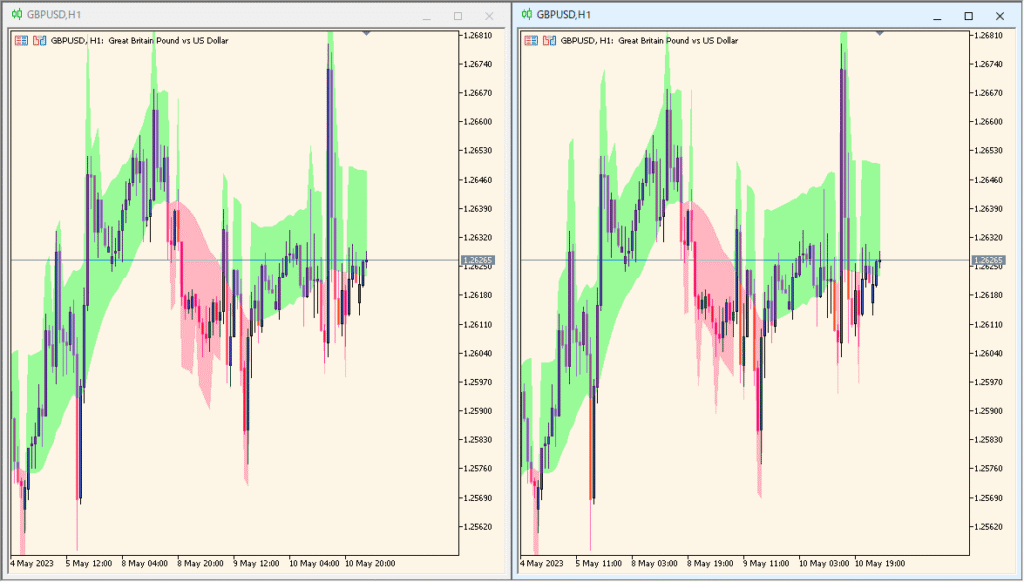
- Filter entries by focusing only on trades aligned with the band direction.
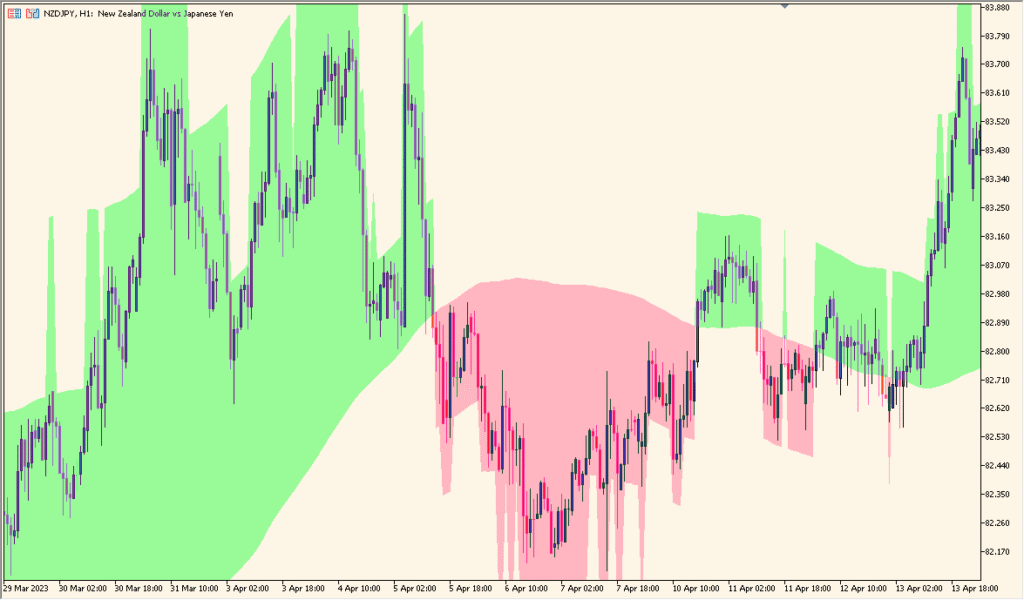
- Visually spot periods of contraction and expansion within the trend zone.
Because the shaded area reacts smoothly to market structure, it works well for traders who want a clean visual guide without relying on multiple indicators.
Parameter Explanations
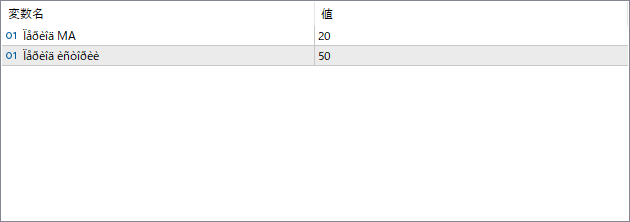
Length MA
Sets the period of the moving average used as the center of the shaded trend zone. A longer MA smooths out price action, while a shorter one reacts faster to market changes.
Length Envelope
Defines how wide the band is around the MA. A larger value produces a broader zone, capturing wider swings, while a smaller value creates a tighter and more sensitive zone.