Overview of the ma_chanels_fibo Indicator
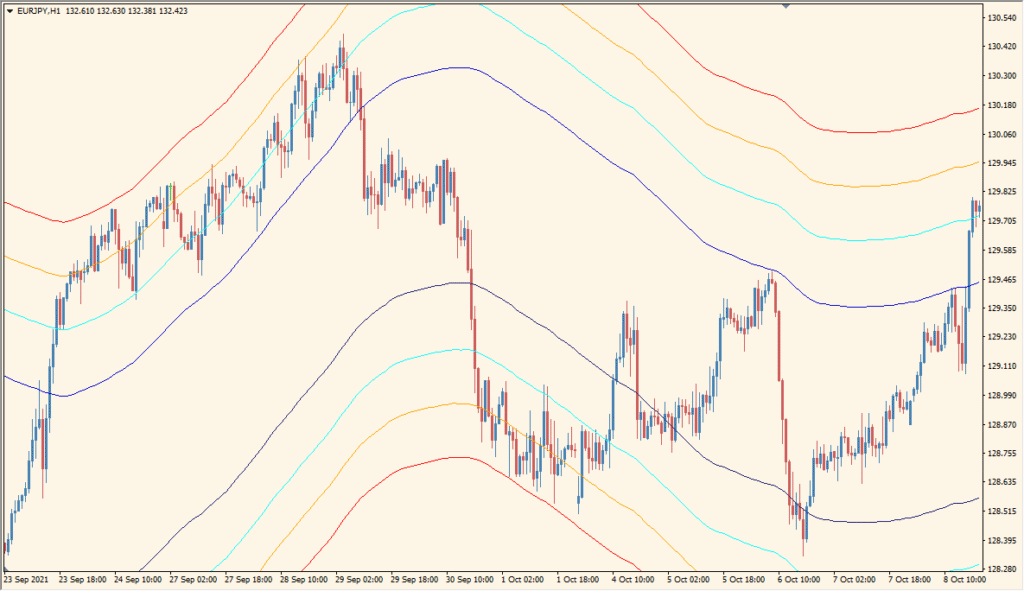
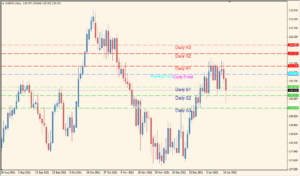
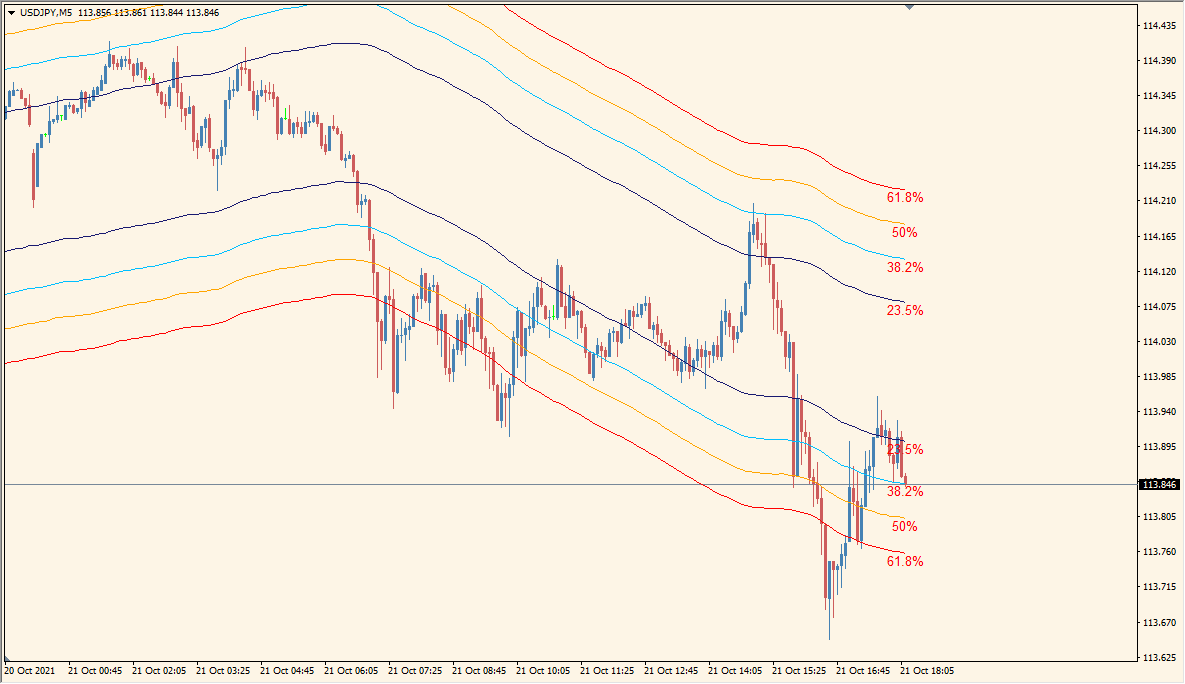
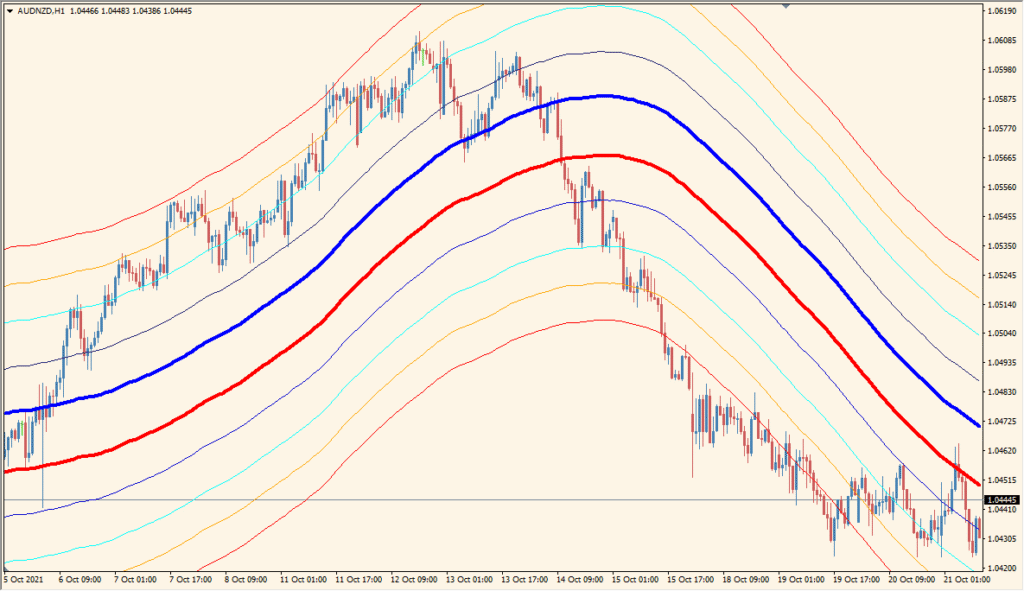
The ma_chanels_fibo indicator plots moving average-based channel lines and overlays Fibonacci percentages relative to the main MA line. This creates a visual reference for potential support/resistance levels or zones of retracement. It’s useful for traders who want to identify reaction areas around a key moving average.
The indicator doesn’t repaint and works by calculating the MA and then projecting fixed-percentage levels above and below, based on Fibonacci ratios (e.g., 23.5%, 38.2%).
How to Use It in Practice
In real-world use, ma_chanels_fibo can help you:
- Quickly spot price interactions with Fibonacci zones around a moving average.
- Determine retracement or continuation potential during trends.
- Use the lines as dynamic support and resistance levels.
- Combine it with other indicators (e.g., RSI or volume) for confirmation.
It is most helpful in trend-following or mean-reversion strategies where MA zones matter for entries or exits.
Parameter Explanations
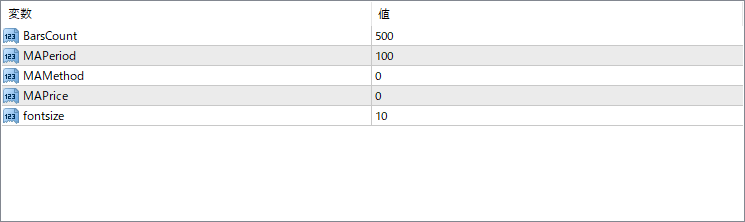
BarsCount
Defines how many candles (bars) to process on the chart. A higher number extends the indicator’s visual range into the past.
MAPeriod
Sets the period of the moving average used to build the central line of the channel.
MAMethod
Determines the type of moving average (e.g., 0 = Simple, 1 = Exponential, etc.).
MAPrice
Selects the price used in the moving average calculation (e.g., close, open, high, low).
fontsize
Adjusts the size of the Fibonacci percentage labels displayed on the chart.