Indicator Overview
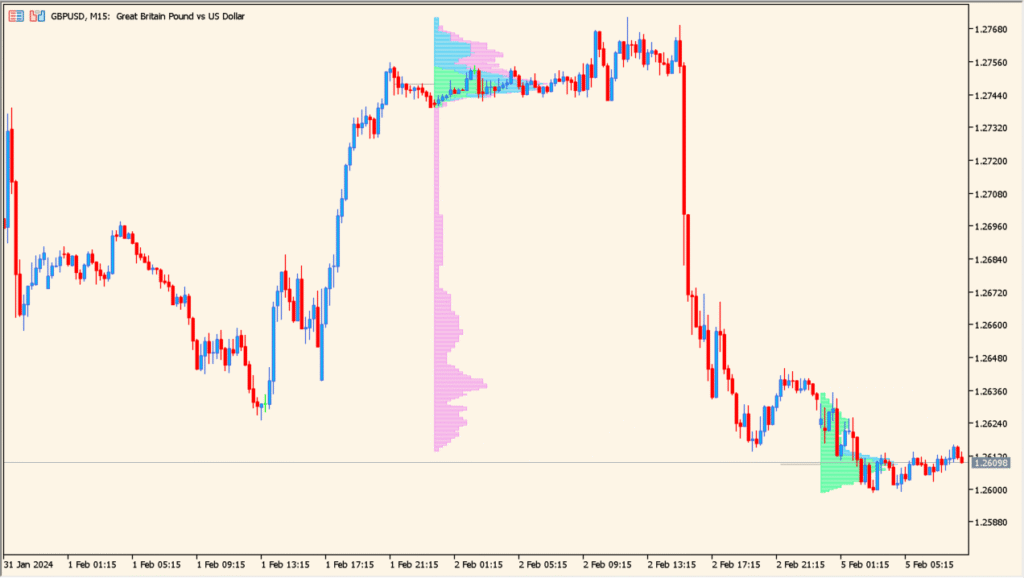
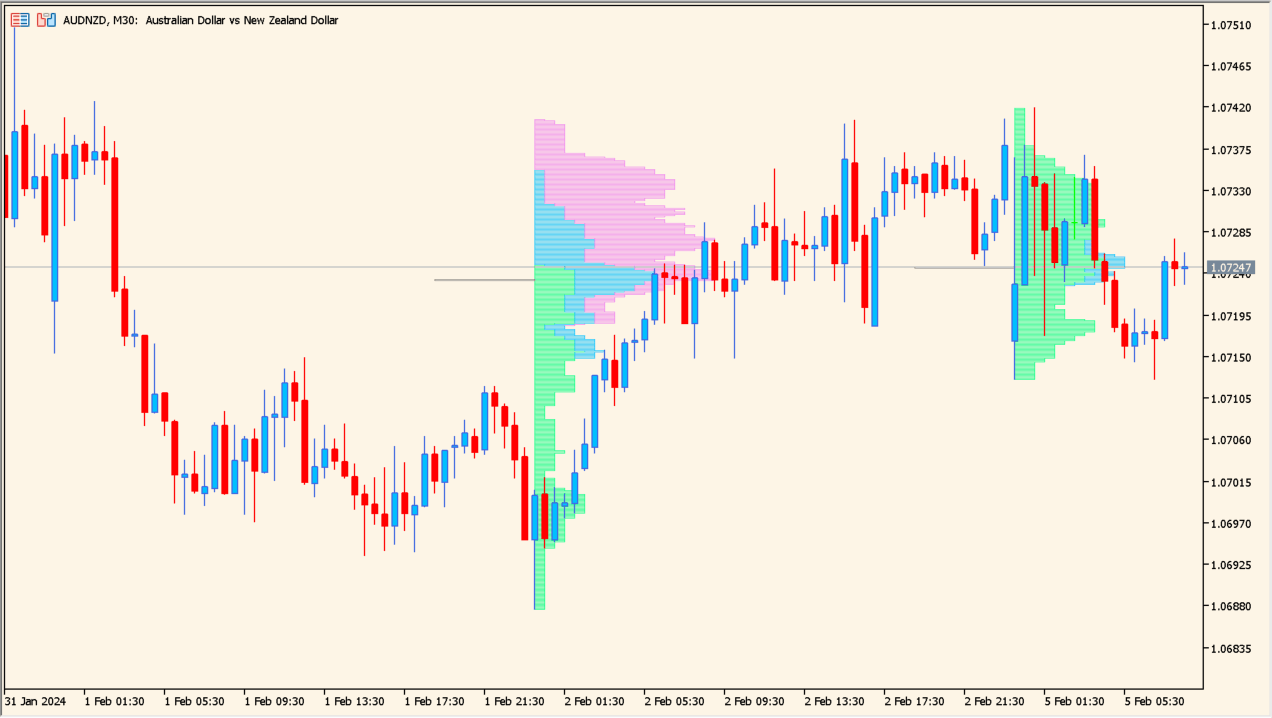
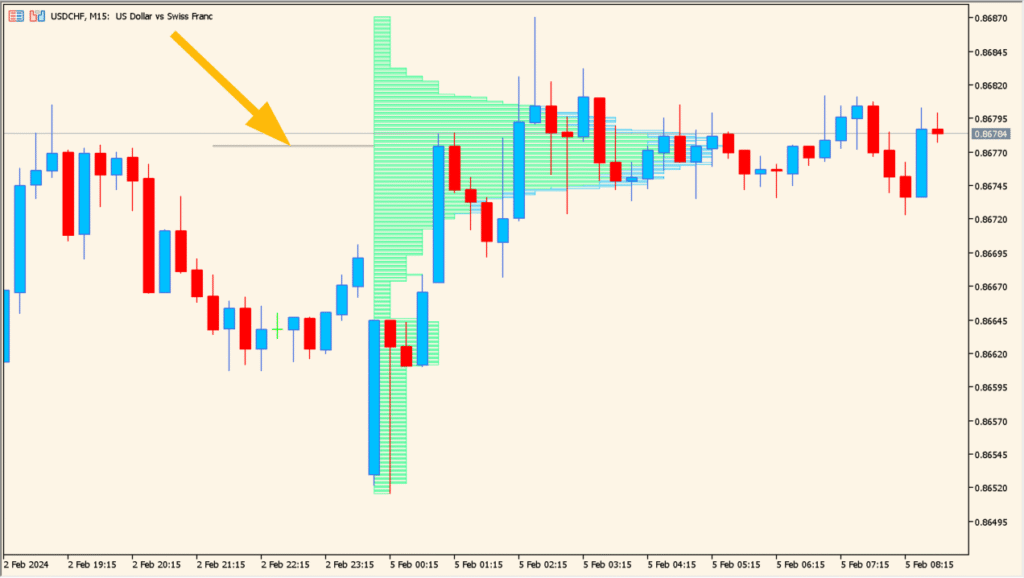
The Market Profile indicator visualizes how price activity is distributed across different price levels over specific sessions or days. Instead of focusing only on price movement, it shows where the market spent the most time, helping traders identify areas of acceptance, rejection, and balance.
By displaying session-based profiles such as Asia, Europe, and America, the indicator highlights key value areas and the median price, offering a clearer view of market structure and participation.
How to Use It in Practice
In practical trading, this indicator can be used to:
- Identify high-activity price zones where the market has accepted value.
- Spot potential support and resistance based on volume concentration rather than single price levels.
- Compare session behavior to see how different market participants influence price.
- Detect balance and imbalance conditions that may precede breakouts or rotations.
This makes the indicator well suited for traders who focus on market structure, intraday context, and session-based analysis.
Parameter Explanations
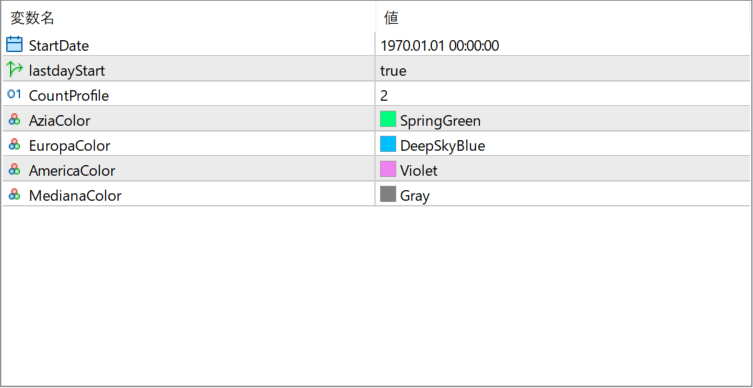
StartDate
Defines the starting point from which the market profile calculation begins.
lastdayStart
When enabled, the indicator automatically starts profiling from the most recent trading day.
CountProfile
Specifies how many market profiles are displayed on the chart at the same time.
AziaColor
Sets the color of the market profile for the Asian trading session.
EuropaColor
Defines the color used for the European trading session profile.
AmericaColor
Defines the color used for the American trading session profile.
MedianaColor
Sets the color of the median or point-of-control line within each profile.