Indicator Overview
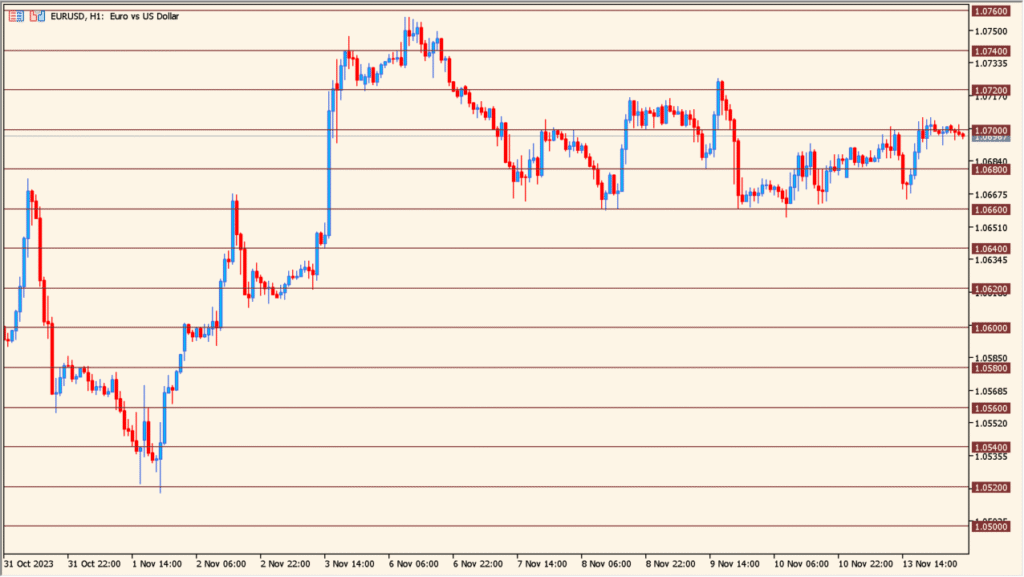
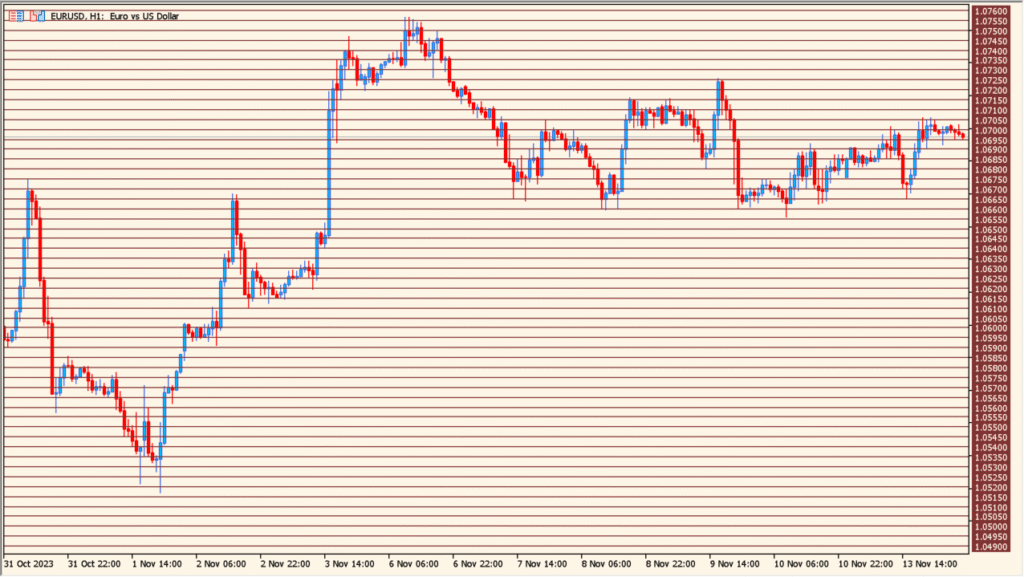
The mfcs_gridlines indicator for MT4 adds fully customizable vertical and horizontal grid lines to the chart. It allows traders to set spacing, style, width, and color of the lines for better visual structure and easier chart reading. This tool is simple but practical, especially for users who rely on consistent chart alignment and visual price organization.
By adjusting the interval, you can control how frequently the lines appear, which helps when analyzing price zones, time cycles, or simply improving chart clarity.
How to Use It in Practice
Here are a few practical uses for mfcs_gridlines:
- Enhance visual readability by defining clearer price and time spacing on charts.
- Assist in spotting repeating price behavior or timing patterns more easily.
- Keep chart structure consistent when analyzing different timeframes.
- Improve alignment for manual drawing tools such as trend lines or zones.
This makes it useful for traders who prefer structured and organized chart layouts.
Parameter Explanations
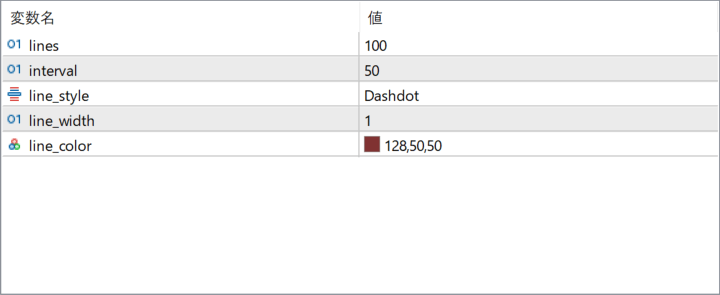
lines
Sets how many grid lines are drawn on the chart.
interval
Defines the spacing between each grid line.
line_style
Specifies the display style of the lines, such as dashed or dotted.
line_width
Controls the thickness of the grid lines.
line_color
Sets the color of the lines used on the chart.