Overview of the MinMax Indicator

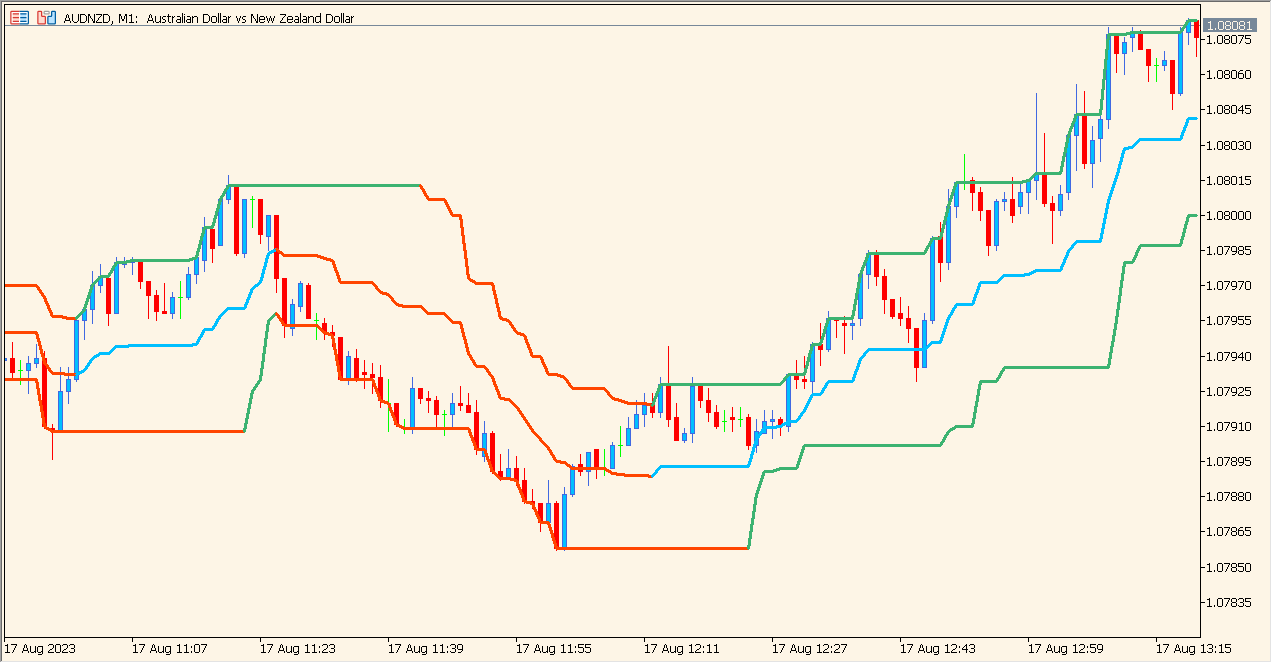
The MinMax indicator for MT5 plots the highest and lowest price levels over a fixed period. It creates two dynamic bands that update as new highs or lows form, giving traders a clean visual of recent market structure. These lines help identify short-term support and resistance based on actual price extremes.
The indicator is straightforward: it checks the selected price source and calculates the maximum and minimum levels within the chosen lookback period, then draws them on the chart as upper and lower boundaries.
How to Use It in Practice
In live trading, the MinMax indicator can be used to:
- Quickly identify short-term support and resistance levels based on recent price extremes.
- See when price breaks above the previous high or below the previous low.
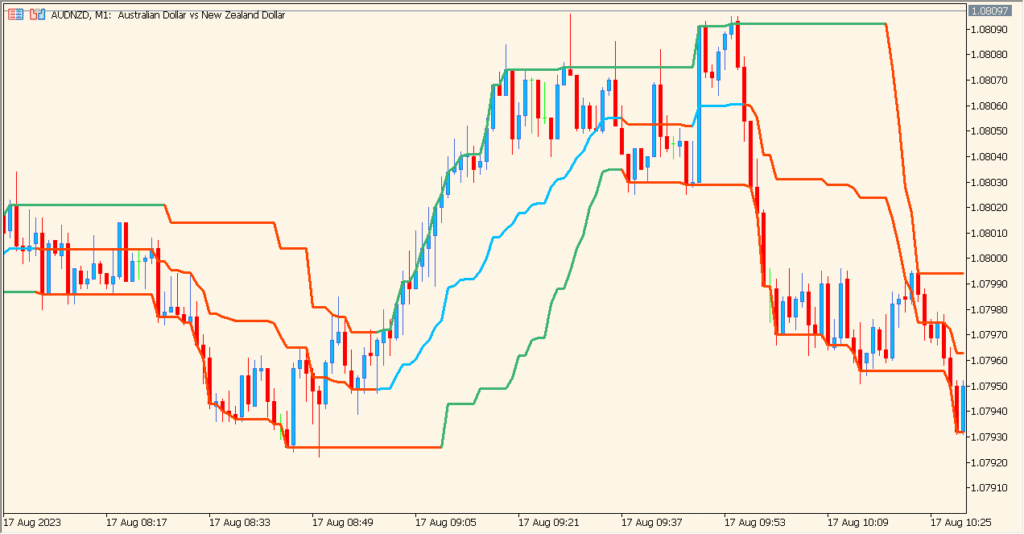
- Support breakout strategies by confirming when structure shifts.
- Help ranging-market strategies by signaling potential reversal zones near the bands.
Because it reacts directly to actual highs and lows, the tool is useful for both scalpers and swing traders who rely on clean structural levels.
Parameter Explanations
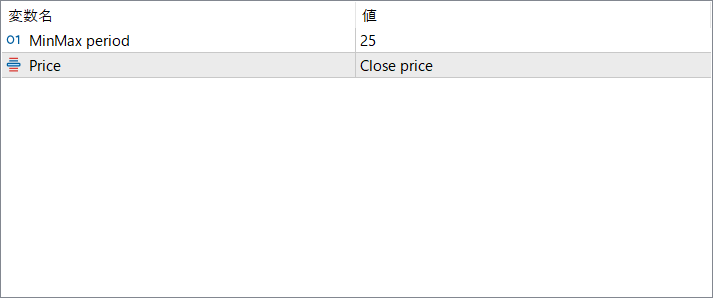
MinMax period
Defines how many past bars are checked to calculate the highest high and lowest low. A larger period smooths the bands and reduces noise, while a shorter period makes the indicator more reactive.
Price
Selects which price source (such as Close, High, Low, etc.) is used when determining the high/low range. Choosing different sources slightly changes how the boundaries are formed.


