Overview of the Indicator
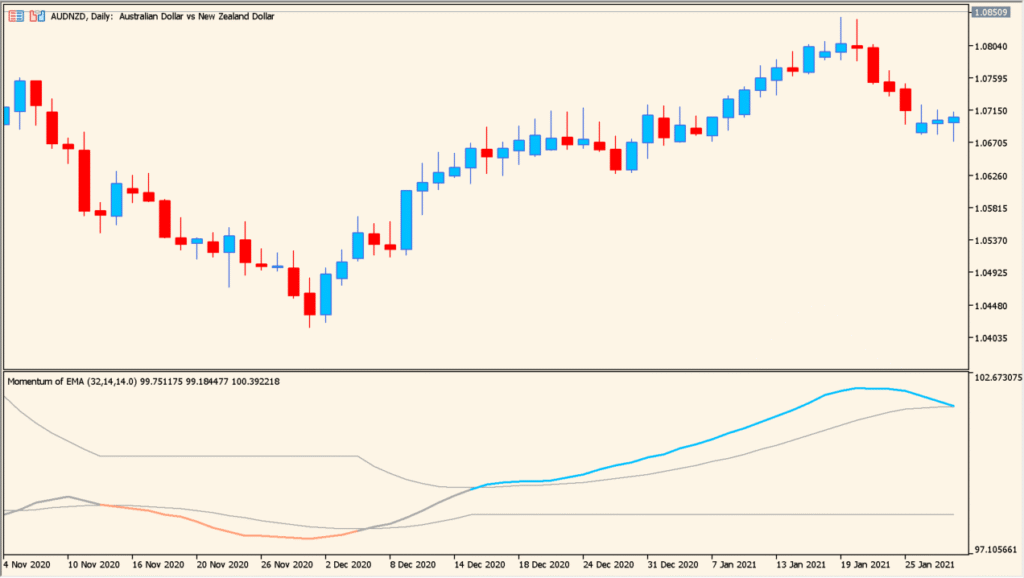
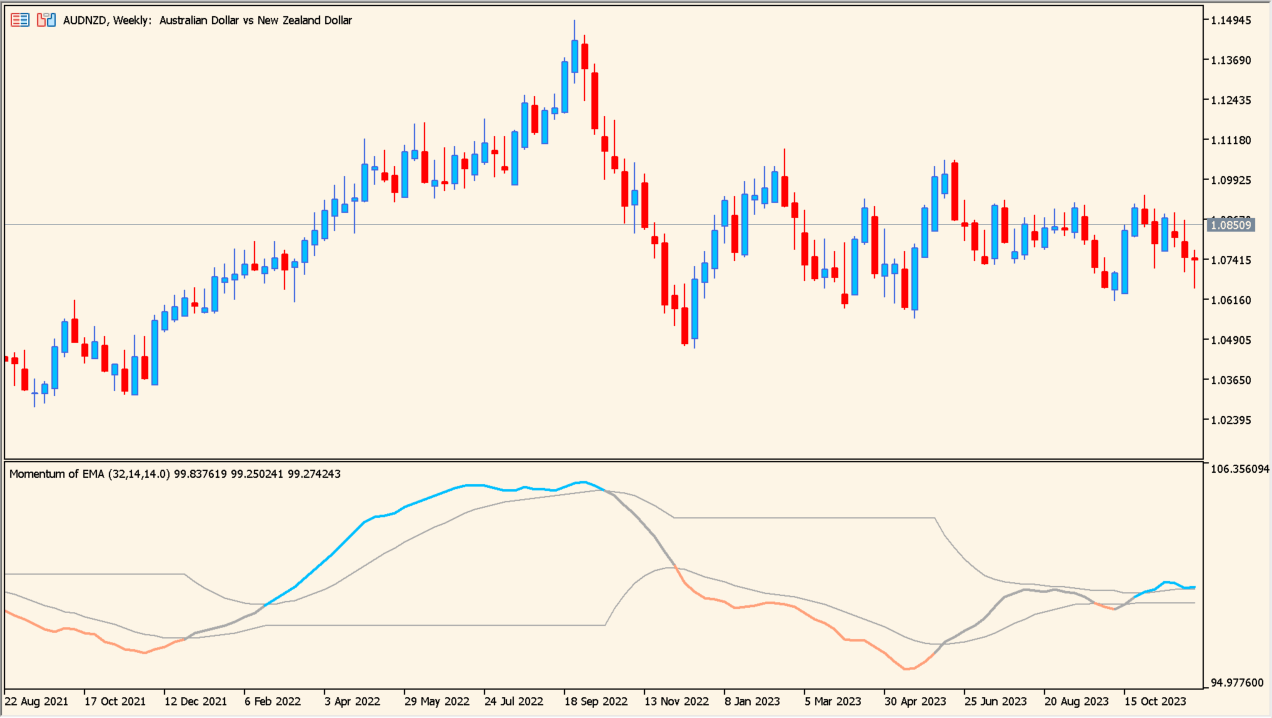
The Momentum of EMA indicator measures price momentum by tracking the rate of change of an exponential moving average. Instead of looking directly at raw price momentum, it focuses on how quickly the EMA itself is accelerating or decelerating.
This approach helps smooth out noise while still capturing shifts in market strength, making momentum changes easier to read in trending and transitioning markets.
How to Use It in Practice

In practical trading, this indicator is commonly used to:
Confirm trend strength by observing whether momentum is rising or falling along with price direction.
Spot early slowdowns in a trend when momentum starts flattening or reversing before price clearly turns.
Use level crossings and color changes as visual cues for potential shifts in bullish or bearish pressure, especially when combined with price action or trend-following tools.
Parameters
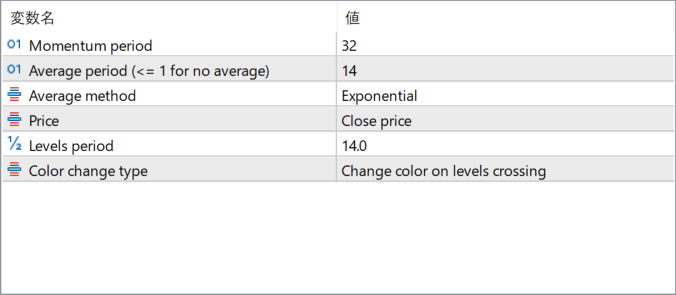
Momentum period
Defines how many bars are used to calculate the momentum of the EMA. Shorter periods react faster, while longer periods emphasize smoother momentum shifts.
Average period (<= 1 for no average)
Controls additional smoothing applied to the momentum line. Setting this to a very low value disables extra averaging.
Average method
Specifies the type of moving average used for smoothing the momentum values, such as exponential or other supported methods.
Price
Determines which price is used in the EMA calculation, typically close price but adjustable if needed.
Levels period
Sets the lookback used to calculate dynamic reference levels, helping to judge whether current momentum is relatively strong or weak.
Color change type
Defines how and when the indicator changes color, usually based on level crossings or momentum direction.